Trading What I see !?


Don't think i've got that "bubble" feeling quite yet! and definitely don't think i've cracked anything yet... but I just thought it would be fun to respond to my frustrated day feeling with quite the opposite showing exactly as you state you've got to look at it weekly/monthly. Hence why i'm not posting a full update til sunday evening...!ShaunWhite wrote: ↑Fri Sep 11, 2020 6:15 pmBut did you trade well? You can get 3 or 4 with your eyes shut, or if you're focusing on steamers then were there more than the usual number of them? and hitting them was easy or even inevitable.
I don't want to burst your bubble but these are some of the reasons people think they've cracked it when they haven't, then raise stakes and come a cropper.
All part of why weekly or monthly stats show a truer picture.
So this weeks results:
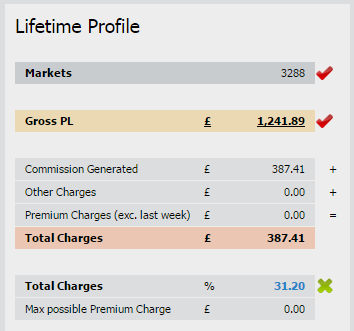
81 markets
52 wins : 29 losses => 64% strike rate
Avg Win : Avg Loss ratio => 0.63 : 1
Net Profit = +£15.32
So reasonable week with it's usual ups and downs... Still struggling with cutting losses, tried not to just dump them, using a more calculated exit, but it still cost me big time on 2 losses which between them cost me -£23 !! if you compare that to my net profit for the week...
So my take away for the week is to chip away at making those losses smaller and avoid those big ones!! and moving myself towards the right of the bell curve, as Peter states here: https://www.youtube.com/watch?v=7Jc_-eKTzvM
Related videos on exiting bad trades:
https://www.youtube.com/watch?v=QvFTWD8I92g
https://www.youtube.com/watch?v=Ds10pLTVeT8

Well done.
Obviously can't close every loss as neat and tidy as you'd like, sometimes you just have to go with the "oh shit" approach and dump it ASAP regardless of price.

not sure how best to put this. i may be reading that chart incorrectly, or the uderlaying stategy may not be obvious. to me, that graph shows a slow spiral of death. if you look at the peaks above ZERO versus the noise below ZERO, you can see that there's a strong negative bias.
can you explain why you fell this is breakeven, other than having clawed back from a losing position to just below breakeven??
sorry if this sounds negative and down on the graph, just find it hard to see that and want to embrace it
This chart is over the last 5 weeks or so, if you read the last 5 weeks of this thread you will see my struggles!!jimibt wrote: ↑Mon Sep 14, 2020 8:48 amnot sure how best to put this. i may be reading that chart incorrectly, or the uderlaying stategy may not be obvious. to me, that graph shows a slow spiral of death. if you look at the peaks above ZERO versus the noise below ZERO, you can see that there's a strong negative bias.
can you explain why you fell this is breakeven, other than having clawed back from a losing position to just below breakeven??
sorry if this sounds negative and down on the graph, just find it hard to see that and want to embrace it
I'm also taking the positive mindset, as per Peter's videos, the chart is well within the realms of randomness, and I am chipping away at moving to the right half of the bell curve, it doesn't take much.. so breakeven at this point is good
Oh and to answer your question! To be only £5 down after 5 weeks and about 350 markets, is good enough breakeven for me !jimibt wrote: ↑Mon Sep 14, 2020 8:48 amnot sure how best to put this. i may be reading that chart incorrectly, or the uderlaying stategy may not be obvious. to me, that graph shows a slow spiral of death. if you look at the peaks above ZERO versus the noise below ZERO, you can see that there's a strong negative bias.
can you explain why you fell this is breakeven, other than having clawed back from a losing position to just below breakeven??
sorry if this sounds negative and down on the graph, just find it hard to see that and want to embrace it
If 350 markets total is all you ever did then I'd expect anyone to be just below breakeven at best. Don't think any of these charts give any real insight yet, for me it's all just a phase of collecting live market experience. Any current strategy talk will most likely be obsolete once you crack it anyway.goat68 wrote: ↑Mon Sep 14, 2020 9:27 amOh and to answer your question! To be only £5 down after 5 weeks and about 350 markets, is good enough breakeven for me !jimibt wrote: ↑Mon Sep 14, 2020 8:48 amnot sure how best to put this. i may be reading that chart incorrectly, or the uderlaying stategy may not be obvious. to me, that graph shows a slow spiral of death. if you look at the peaks above ZERO versus the noise below ZERO, you can see that there's a strong negative bias.
can you explain why you fell this is breakeven, other than having clawed back from a losing position to just below breakeven??
sorry if this sounds negative and down on the graph, just find it hard to see that and want to embrace it
For what it's worth back in 2014 (my first year) I needed 3000+ markets worth of experience to even start profiting, with a mix of football and racing. To crack it after just 350 markets you would truly be G.O.A.T.
-
wearthefoxhat

- Posts: 3221
- Joined: Sun Feb 18, 2018 9:55 am
Kai wrote: ↑Mon Sep 14, 2020 9:54 amIf 350 markets total is all you ever did then I'd expect anyone to be just below breakeven at best. Don't think any of these charts give any real insight yet, for me it's all just a phase of collecting live market experience. Any current strategy talk will most likely be obsolete once you crack it anyway.goat68 wrote: ↑Mon Sep 14, 2020 9:27 amOh and to answer your question! To be only £5 down after 5 weeks and about 350 markets, is good enough breakeven for me !jimibt wrote: ↑Mon Sep 14, 2020 8:48 am
not sure how best to put this. i may be reading that chart incorrectly, or the uderlaying stategy may not be obvious. to me, that graph shows a slow spiral of death. if you look at the peaks above ZERO versus the noise below ZERO, you can see that there's a strong negative bias.
can you explain why you fell this is breakeven, other than having clawed back from a losing position to just below breakeven??
sorry if this sounds negative and down on the graph, just find it hard to see that and want to embrace it
For what it's worth back in 2014 (my first year) I needed 3000+ markets worth of experience to even start profiting, with a mix of football and racing. To crack it after just 350 markets you would truly be G.O.A.T.
You probably make that easily in a week nowadays...(automation/semi-automation)
Make what?wearthefoxhat wrote: ↑Mon Sep 14, 2020 9:58 amYou probably make that easily in a week nowadays...(automation/semi-automation)
Isn't he trading full manual?
I agree, just trying to answer jimibt's negative vibes...!Kai wrote: ↑Mon Sep 14, 2020 9:54 amIf 350 markets total is all you ever did then I'd expect anyone to be just below breakeven at best. Don't think any of these charts give any real insight yet, for me it's all just a phase of collecting live market experience. Any current strategy talk will most likely be obsolete once you crack it anyway.goat68 wrote: ↑Mon Sep 14, 2020 9:27 amOh and to answer your question! To be only £5 down after 5 weeks and about 350 markets, is good enough breakeven for me !jimibt wrote: ↑Mon Sep 14, 2020 8:48 am
not sure how best to put this. i may be reading that chart incorrectly, or the uderlaying stategy may not be obvious. to me, that graph shows a slow spiral of death. if you look at the peaks above ZERO versus the noise below ZERO, you can see that there's a strong negative bias.
can you explain why you fell this is breakeven, other than having clawed back from a losing position to just below breakeven??
sorry if this sounds negative and down on the graph, just find it hard to see that and want to embrace it
For what it's worth back in 2014 (my first year) I needed 3000+ markets worth of experience to even start profiting, with a mix of football and racing. To crack it after just 350 markets you would truly be G.O.A.T.
lol... i think they were constructive (or at least intended to be). my point is (and was highlighted by kai), a small sample will not give you insight into the path fwd. also, if you presented that graph as an indication of progress, then I'd say that the earlier trades were showing smaller variance and a more positive trajectory. you have arrived at a breakeven point after a very turbulent negative phase, that was my quandary really.goat68 wrote: ↑Mon Sep 14, 2020 10:15 amI agree, just trying to answer jimibt's negative vibes...!Kai wrote: ↑Mon Sep 14, 2020 9:54 amIf 350 markets total is all you ever did then I'd expect anyone to be just below breakeven at best. Don't think any of these charts give any real insight yet, for me it's all just a phase of collecting live market experience. Any current strategy talk will most likely be obsolete once you crack it anyway.
For what it's worth back in 2014 (my first year) I needed 3000+ markets worth of experience to even start profiting, with a mix of football and racing. To crack it after just 350 markets you would truly be G.O.A.T.
I know it can read as -ve, that's not my objective, i'm just trying to understand more the graph's guiding principles.
Don't think Jimbo was trying to be a negative Nancy and suggesting that you were going backwards  I'm sure he agrees that the first 300 markets are less important than the next 3000 markets, so I wouldn't be reading too much into that.
And I think Mr Fox was saying you can collect 3000 markets inside a week, but I don't see how that is relevant to a manual trader, it's not like you can absorb this experience somehow via the auto route.
And I think Mr Fox was saying you can collect 3000 markets inside a week, but I don't see how that is relevant to a manual trader, it's not like you can absorb this experience somehow via the auto route.
-
spreadbetting
- Posts: 3140
- Joined: Sun Jan 31, 2010 8:06 pm
Think the last thing Jimbo wants to be is some kind of Nancy, he'd be chased off the forum.