The main difference between this screen and the normal Betfair screen is that you only need to point and click your mouse on a price to enter a bet or order into the market. You can do this because you pre-set the stakes you wish to use. This means that when you click Bet Angel already knows how much you want to place in the market.
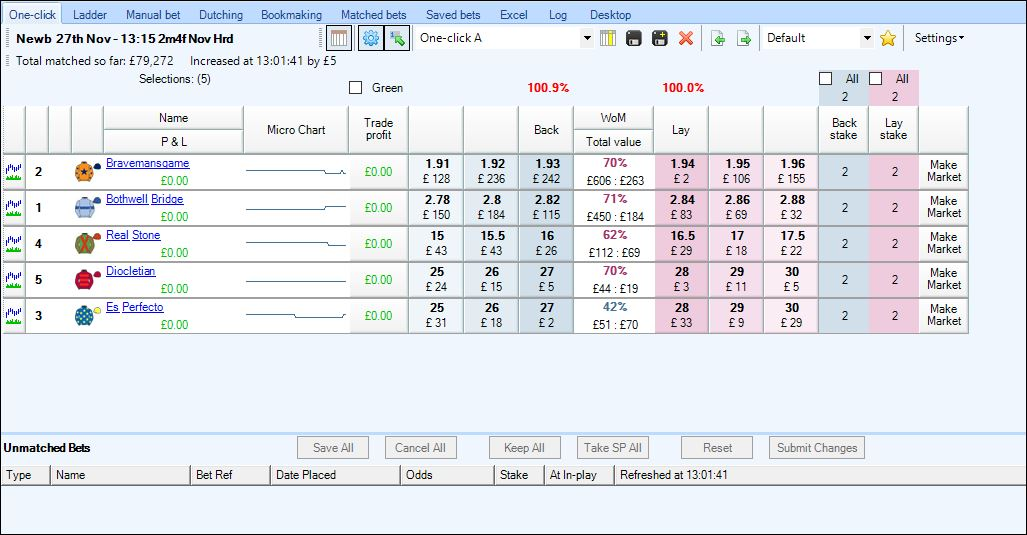
The main screen is colour coded so you can see at a glance what type of order you are placing in the market. If you see a blue shaded price and click on it Bet Angel will place an order into the market on that selection at the price you clicked at. The amount it placed is determined by the stake value on the far right of this screen. In this example if we click on the row containing ‘Bravemansgrave’ at a price of 1.91, Bet Angel would place an order into the market by backing ‘Bravemansgrave’ with £2 at 1.93. Because the current best market price is better than 1.91 to back, the exchange will fill your order at the best available price. In this case your order would fill at 1.93
If you click on the red / pink areas instead of placing a back order Bet Angel will place a lay order into the market. If there is not enough money to fill your order the remaining portion of the unmatched bet will appear in the unmatched bet area of Bet Angel below the main one click trading screen.
Adjusting the value of your one click stakes
To adjust the value of your one click orders you need to adjust the values you see in the ‘stakes’ boxes to the right of the main odds.
Adjusting these means that if you click on any selection in the market you will place an order into the market for the value you see in theses boxes. There are two prices, one for the back price and one for the lay price. For speed there is also a stake all tick box. Ticking this box will mean that you can apply the stake to the right of this area to every selection in the market. This is useful for broad strategies or for simply making sure that you do not place a bet in the market for too much by accident.
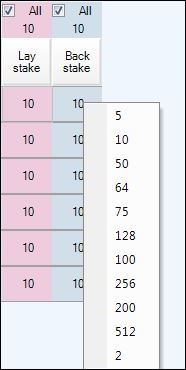
You can also select from the 'Preset' stakes you have saved on your ladder screen by right clicking on a stake value, the list of your presets will then appear for you to quickly select the one required.
By right clicking in either of the top 'All' boxes you can select a preset stake for ALL selections in one go
Understanding the screen
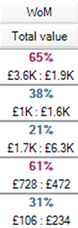 There are other numbers, functions and columns on the screen that display information or perform specific functions. In the middle of the rows is a percentage number, this number represents the weight of money in a market on the selection. If there is £2500 to back and £5000 to lay the weight of money will show 33%. This is indicating that there is more money on the lay side than the back side. If we assumed, theoretically, that money was arriving in the market at the same rate on both sides then would hypothesise that the back side would be ‘eaten’ through first. Therefore the price would likely come in and the price will get smaller. Therefore when this number is less than 50%, indicating more money on the lay than the back side it shows in blue. If the price is higher than 50% it will show in red indicating pressure on the price to drift.
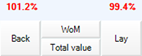 The figures at the top of the list of selections are the book % value. This is the total value of the book on either the back or lay side. Layers could make money by laying a book above 100% and backers by backing below 100%. This number will give you a feel for how much money is ‘lost’ to both sides of the book and how efficient the market is. If a situation occurs where the book slips under or over 100% the column number will turn green to indicate that you could have performed book arbitrage on the market. Read the book making or dutching section of this user guide to learn how you can do this.
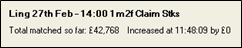 The current market you are on is displayed on the top left of the screen along with how much money has been matched on this market and the last and average increase in volume. You can set the average volume settings from the settings editor, there is no pre-set standard for average volume and it is simply user defined.
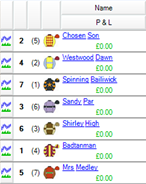
On the left of the screen are the selections available in this market. If you are in a horse racing market each selection will display supplementary information such as the jockey silks, the saddlecloth number and, if you hover your mouse over that selection, additional details about the runner. Each selection is displayed along with the current profit and loss underneath each selection. The number in brackets is the stall draw number. As you place orders in the market you will see your potential profit or loss on each selection if that selection goes on to win. If you click on the name of the selection you will bring up the Betfair charts for that selection. Click on the refresh button to bring the latest chart to this area. If you wish you can also get the chart to automatically refresh at a pre-defined time interval.
The chart on the left represents the range in which the price / odds have traded since the market was opened. This will give you a feel for how volatile the market is and whether the price is predominately moving in one direction or another. The grey lines underneath the red odds line is the amount of money, the volume, bet at that price, at that particular moment in time. The charts are linear, they move with time, but because there are Betfair generated Bet Angel can’t interpret over which time period the charts were generated.
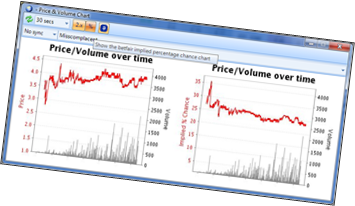 The chart on the right is the implied chance graph; this is the inverse of the odds available. If a selection is trading at digital odds of 2.00 on the implied chance chart it will be display at 50%. The calculation is 1/2.00 = 0.50 or 50%. The implied chance, unsurprisingly, is telling you what chance this selection has of being a winning bet. At least this shows the markets interpretation of that chance. If you felt it was more than this then there is value backing the selection, if you think there is less you would lay it. From a trading perspective you should use these graphs to instantly asses if there is any long term trend, what that trend is and how much the price has been moving. This is a good way to understand the general market movements.
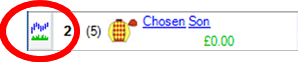 To the very far left of this section there is the Bet Angel Graphing button. Clicking on this button will take you to the dedicated streaming charting area of Bet Angel. This allows you to plot custom made charts based on a variety of prices and indicators. If you would like to know more about this function please refer to the Bet Angel Charting section of this user guide.