Creating your own market interface
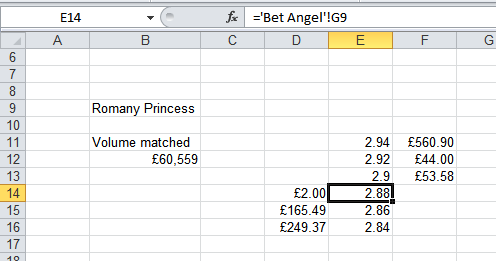
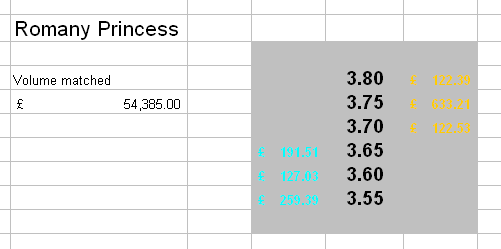
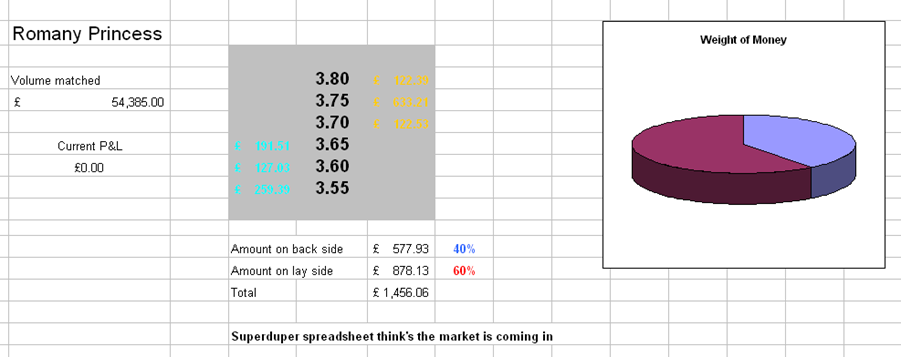
Once you have the data in the new spreadsheet you can move and manipulate the data at will by dragging and dropping cells. You can see here that we have copied across cell references that are reading information on the current available odds and also the current totals available at those odds. This has had the effect of turning the ‘normal’ Betfair screen into a vertical display. This has been achieved by, not copying the content of the cells, but by making a relative reference to those cells. You can see in this example that the odds of ‘3.65’ come from ‘Bet Angel!G15’. If the odds or the money available change on Bet Angel they will now automatically change on your new spreadsheet.
Formatting the display
Once you have the general look and feel you like you can apply formatting functions of Excel to make the display more pleasing. Right clicking on a blank area on the Excel main toolbar menu brings up the toolbar options list. From this list you can select and use the many formatting options in Excel. They allow you to change the appearance of text and also the colour, add pictures and other items. If you are unsure of where the formatting options are in Excel or how to use them, press F1 in Excel for help.
Now we have formatted and changed the look of our data we can start adding some more complicated functions and interpretation of this core data. To do this we will use predominately Excel based commands and formulas.
Creating your own market indicators
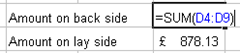
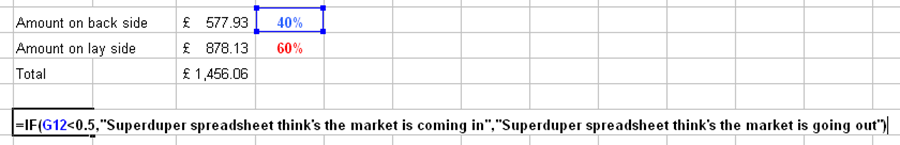
I have decided I want to create a weight of money measure, to do this I need to add up all the money on the back and lay side of the book. In Excel you can use the command ‘=SUM’ to add up these values. On the spreadsheet you add up all the values in those cells to produce the total of money on one side of the book or another.
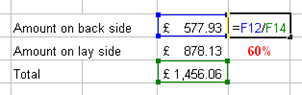
When we have completed that we can subtotal these values into another cell and calculate the weight of money percentage. Here you can see I enter a formula that divides the amount of the back side by the total of both back and lay side. Excel now represents these calculations as percentage figures for you to quickly asses the weight of money on either side of the book.
We have enhanced this further by using the conditional formatting option in Excel. This allows you to highlight, colour and emphasise text in Excel according to its underlying value. Here you can see that we have set it to turn red if it is greater than 50% or turn blue if the cell value is lower than or equal to 50%. There are many ‘tricks’ in Excel that allow you to change the way text and information is displayed, ensuring you are familiar will all of them if you want to get the best experience from the Excel integration.
You can also use Excel to ‘flag’ market characteristics to you to help you interpret what is happening in a market. Using the hypothesis that weight of money will help push prices in one direction or another we have created an ‘IF’ based formula to display text when it spots one characteristic or another. Rather than just relying on the colour blue or red on the weight of money percentage figures it will now display text telling us what it thinks. We have set the ‘IF’ command so that if the back percentage is less than 50% it will display text alerting us that it thinks the price will get smaller. If not, it will display text alerting us to the opposing situation.
Standard Excel tools are also able to be applied to your spreadsheet as well. You can see that we have used the graphing tool to plot a pie chart of the weight of money. This will update automatically as the market progresses. Pretty much anything is possible in Excel with some ingenuity and a grasp of Excel functionality.
We now have a spreadsheet that has pulled information from the main Bet Angel spreadsheet. It has displayed this information in a manner that we would like and it is also displaying supplementary information based upon our automatically translated interpretation of that data. The one problem with this spreadsheet though is that all it is doing is displaying information; you are not interacting with it or placing orders through it.
The next step in learning to use Excel fully is to create functions that will allow you to activate a bet or process, to place a bet from your spreadsheet.
Getting the most out of Excel automation
It is possible to write completely automatic trading tools for Bet Angel using Microsoft Visual Basic for applications. This tool is included in Excel and can be used to elevate automation to another level with Bet Angel. However, VBA, is beyond the scope of this document and of our support team as it is a complex and detailed language. It is something that you will need to learn and write independently and seek specialist advice if you are interested in pursuing this level of sophistication.
It is possible to write very complex spreadsheets even without the help of tools such as VBA though and a lot of Bet Angel was first created by implementing the concept on a spreadsheet before putting it into the actual product. Creating automatic trading functions can be achieved in a non-complex manner