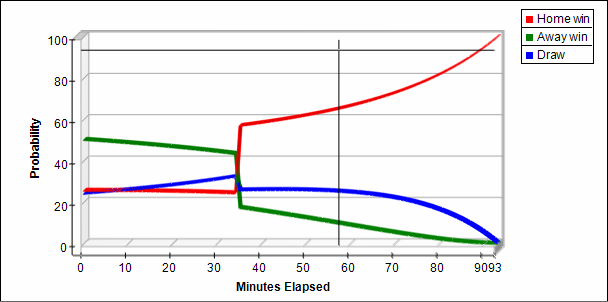
Clicking on either the ‘Match odds probability’ or the ‘Over / Under probability’ tabs will
reveal a visual representation of how the match will progress.
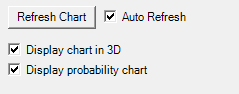
The graph can be re-sized and can also be displayed in an eye pleasing 3D format, or a more precise 2D format. You can also display the odds in probability terms, i.e. the percentage chance of something occurring, or in decimal odds. The reason soccer mystic displays odds in percentage terms is because this makes it much easier to read and interpret. This also allows you to see how the odds move in proportion to each other. If you un-tick the ‘display probability chart’ option the chart will display in decimal odds and allow you to limit the decimal odds to a reasonable number so as not to distort the display. To practice we suggest switching the 3D off and remaining on the probability charts until you get familiar with using the charting capability.
To see a detailed example of how Soccer Mystic can be used to find a trading opportunity see this thread from our forum