Soccer Mystic profit line
You can set visible data lines on the chart very easily. The default is for all the data lines to be switched on but most people tend to looking at the match from one particular perspective, a win for the home team, a win for the away team or a draw. Therefore it makes sense to switch off unwanted lines. Let us assume that in this match we want to assess how the price of the draw moves as the match progresses.
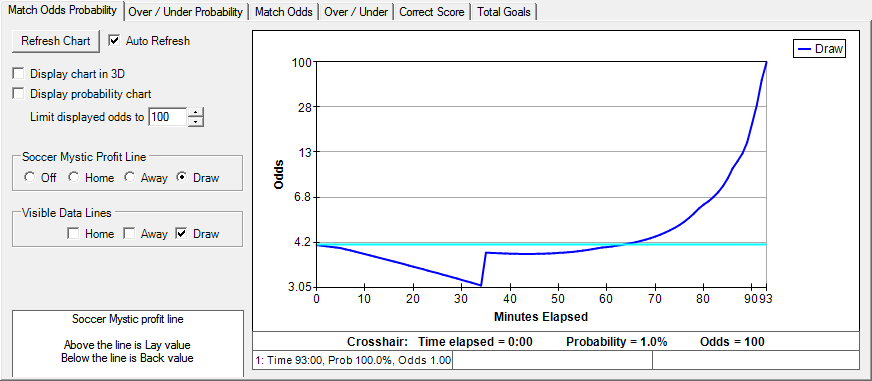
In this example we have switched off the data lines for the home and away win and just left the draw plot on the chart. We have also switched off the 3D display. If you move your mouse over the chart you will see that a set of cross hairs appears and this allows you to pin point how the odds move, how much and over what time.
As the match starts the draw gets more certain and therefore the price of the draw has come in to around 2.66. At that point the goal is scored and the price on the draw jumps out as expected. If we use the cross hairs we can point and click at any two areas and the bottom of the chart populates with the price and time data at the first click, then the price and time at the second click and also the difference, the potential profit, between the two. You can see from this example that the price jumped out quite a bit when the goal was scored. As the match progressed and there were no more goals and the price continued to drift right out. Of course, by then, you would have made your money and be long gone from the market!
It is highly unlikely that you would have been active and in the market just before a goal, in fact you are more likely to have taken a position before the match started. If we were laying the draw and looking for a goal to be scored, that is a much more likely scenario.
The Soccer Mystic profit line allows you to see at a glance just how a scenario like this could play out. When you switch on the profit line, Soccer Mystic draws a line across the entire chart to illustrate to you periods when a backing or laying strategy would make sense. In this example you can see that for the vast majority of the match the draw is trading at a price much higher than it started at. Therefore you should lay the draw as you get plenty of time to profit from this scenario. When you use the profit line a useful reminder appears in the bottom left of the charting area indicating which scenario is the best to adopt given your scenario.
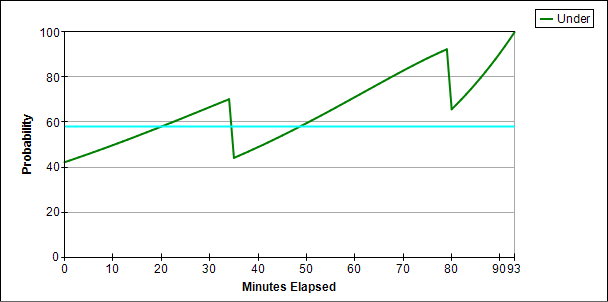
You can use the profit line on the Over / under area charting area also and just ‘playing’ around with different scenario using the charting is a good way of getting an idea of which strategy you should adopt in a match.
In this chart of the over / under market you can see that we are in profit for the whole of this match whatever happens and despite the fact that there have been two goals scored! If you wish you can change the target number of goals required on the chart and Soccer Mystic will instantly recalculate the chart for you so you can dynamically decide what the best strategy will be.
Using charting in-play, synchronising the predictors clock
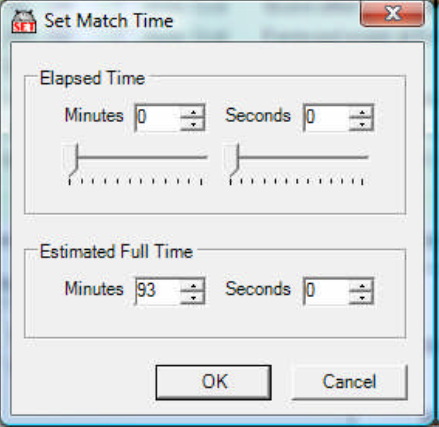
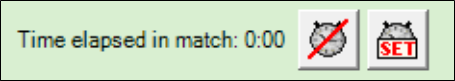
If you intend to use the Soccer Mystic price predictor in-play, it is critical to align both the goals and the time to match exactly the underlying characteristics in the match. To do this set your goals in the ‘goal times’ area and then set the time by clicking on the clock ‘SET’ icon. A dialogue box will appear with settings for the elapsed time and the estimated full time. Use the sliders, the boxes or right click to set the times.
When the time is correct then click to the left of the ‘SET’ clock and Soccer Mystic will set the clock in motion and ensure that it is fully synchronized. This ensures that the prediction is automatically adjusted for the amount of time already gone in the match and the amount of time left in the match.
Video Tutorial