The ladder interface will also show the recently traded volume if this option is selected in the general ladder settings.
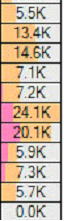
The orange area above shows the total traded in a graphic format and will relate to the figures you see.
The pink part of the chart shows the total traded in the time frame set in the settings editor. This is set to 60 seconds as a default. This area of the display can be very useful as it highlights where the market is currently trading. If you come into a market afresh it is often tricky to know where the money is trading so this new feature gives an instant visual clue. In a slow market, or if you have come to a market early, you will often see no activity. This can also help you as it is often better to trade when the money is flowing into the market i.e. when the preceding race has finished.