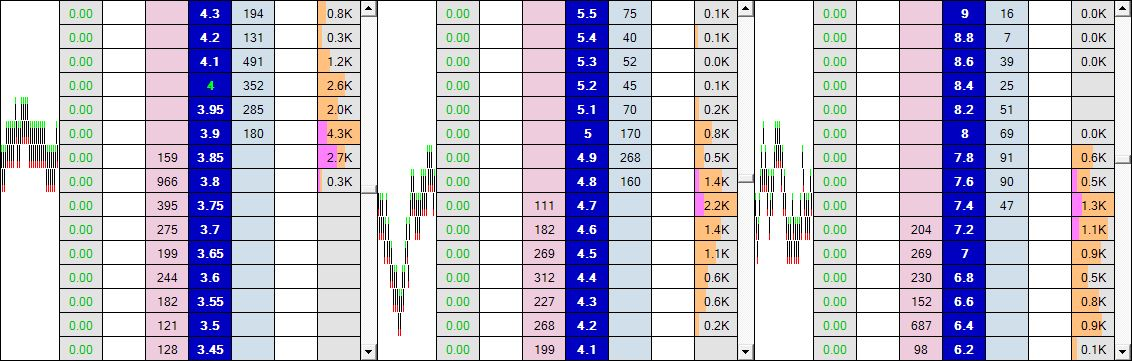
The Matchstick chart (Last Traded Price Column) when enabled appears to the left of each ladder. Unlike other chart types the matchstick chart is not a time based chart and is instead plotted using the last traded price. This means as market activity increases so will the speed the chart is plotted.
To enable the Matchstick charts go to the columns tab within the main ladder settings tool.
Also in the setting area you have a number of options available including how wide to make the charting area and how you would like the matchsticks displayed, for example, you can have a solid colour or chose to have the tips highlighted, with the tips highlighted if the last traded price was higher than the previous traded price then the tip will be green, if the last traded price is now lower it will have a red tip.