Betfair Price Charts Get a Facelift
Betfair’s price/volume charts have looked broadly the same since the Exchange launched, but overnight they rolled out a brand-new interface. Early adopters on the Bet Angel forum were quick to spot the change and begin dissecting the finer points.
What’s New? A Side-by-Side Comparison
Below are two screenshots of the same Goodwood meeting taken 24 hours apart:
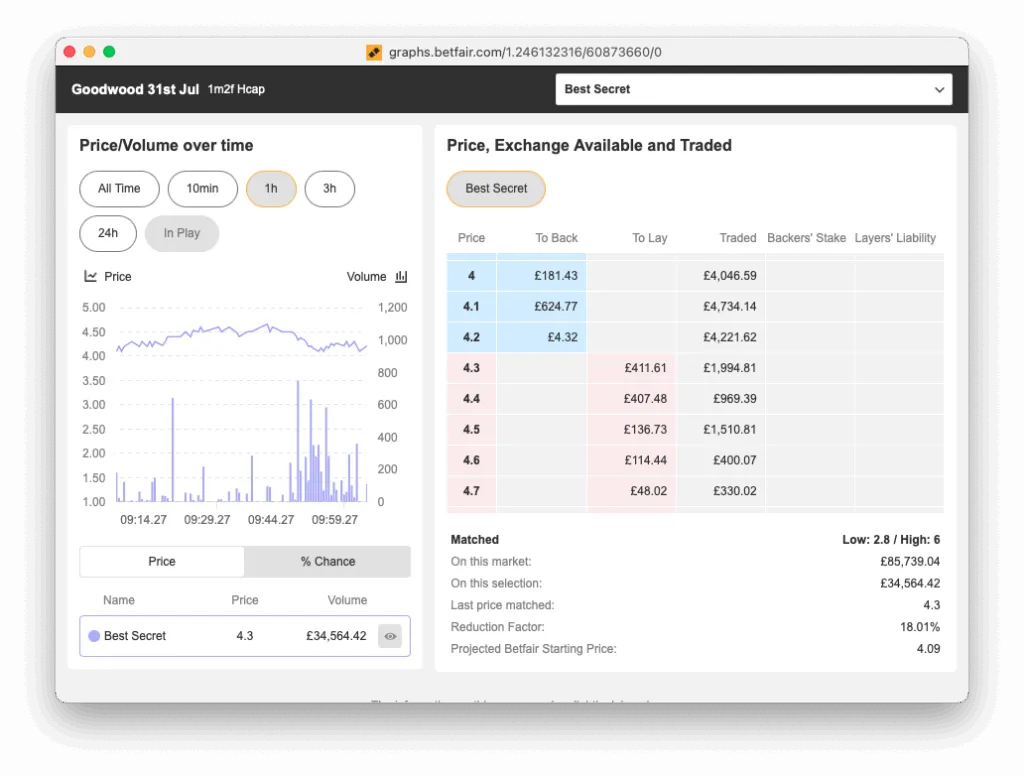
- New style (31 July) – runner Best Secret
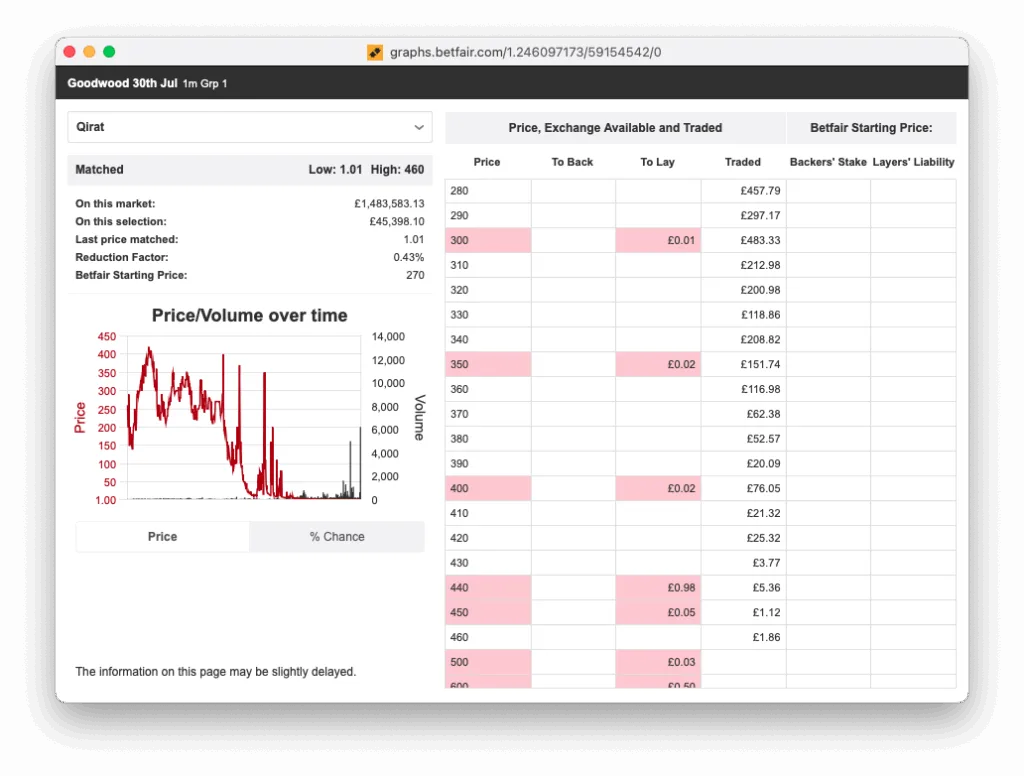
- Legacy style (30 July) – runner Qirat
Key improvements you’ll notice immediately:
- Interactive time filters – Toggle between All Time, 10 min, 1 h, 3 h, 24 h and In-Play with a single click.
- Cleaner dual-axis plotting – Price appears as a smooth purple line, with volume bars layered beneath on the same panel.
- Instant market stats – Low/high range, traded volume, reduction factor and projected BSP sit in one neat summary box.
- Implied probability toggle – Switching to % Chance converts decimal odds to probability on the fly.
Why the New Design Is More Useful
- Faster decision-making – Zooming into the last ten minutes lets traders get better info.
- Greater context – Seeing volume bars in proportion to price moves clarifies whether a drift or steam is driven by genuine money or thin liquidity.
- Most consistent display – Old charts were notoriously unreliable and non linear
Bet Angel’s Advanced Charting – Power Features You Shouldn’t Overlook
While Betfair’s facelift is welcome, Bet Angel’s own charting suite still offers several advantages for serious traders:
- Deep customisation – Change colours, line styles and axes; overlay indicators such as moving averages, VWAP, RSI or MACD; and save layouts as reusable templates.
- Data storage and playback – Bet Angel records every price tick and matched volume, so you can rewind charts, review your entry/exit points, or export raw data for modelling.
- Plot your own data – Using history lists you can gather and plot custom data in a chart
- Multiple chart types – Run price, traded-volume, cumulative volume, candlestick and custom indicator charts side-by-side, either docked to the ladder or in floating windows.
- Zooming and panning – Mouse-wheel zoom lets you drill into a single spike; click-and-drag pans the timeline so you can examine any section without losing context.
- Linked chart groups – Synchronise several charts to the same selection or link them to different runners to monitor correlations in real time.
- Display multiple views – View different custom charts all at the same time on the same selection.
If you pair Betfair’s refreshed visuals with Bet Angel’s advanced toolkit, you get the best of both worlds: quick on-exchange snapshots plus professional-grade custome analysis and data.
Watch the video for more information on using Bet Angel Advanced charting: –
Final Thoughts
Betfair’s new price charts represent the biggest visual upgrade to the Exchange in years. The interactive timeframes and consistent plots are much better. Combine them with Bet Angel’s advanced charting features and you’ll have an unmatched view of market micro-structure—crucial whether you scalp for half-ticks or swing trade longer arcs.