How much do traders match on a horse race?
In early September there is a meeting at Salisbury, it’s feature race is the Dick Poole Filles stakes. This meeting has some significance for all traders.
Why it’s an important race
Way back in 2003 Betfair published information on a specific race.
Betfair went full disclosure on the race. It listed all the market participants what they did, how much they did, how many accounts were active overall and similar information.
On seeing this publication, I realised that it gave me insight that may be useful then and in the future. I now use the data from back then and current data to look at subtle differences that now occur, how that affects the underlying market and what has changed since then.
Persistent biases
The most interesting thing is that most of what I discovered within that data persists to this day. What I mean is that the biases I see in the market are more or less similar to back in 2003.
Obviously, markets, their structure and participants change to a certain extent. But ultimately, the biases inherent in that data more or less persist. This is interesting as it implies that some of what goes on in the market is built into the psychology of the participants in the market.
It’s something that I’ve spent a lot of time trying to understand by trying to quantify and explain it.
In the time since I started studying this, I’ve moved from curiosity to a complete understanding of exactly why these biases occur and how they repeat. It’s been part of my continued quest to get a much deeper understanding of the market.
This was one of those lightbulb moments for me as I realised that my starting point of pursuing just a very good quantitative approach to the market was missing a trick. This shifted my focus to understanding the way the market behaved given certain information.
If you knew what was likely, you could predict what was likely to happen and how people would react to it.
One of the revealing parts of the report was that even back in 2003, there were people who placed back and lay best, traders. They accounted for just under half the market by volume. People often ask how many traders there are in the market and what volume they account for. Well, back in 2003, it was 50% of the entire market.
I would imagine with automation, it’s probably a bit higher now.
The intervening years
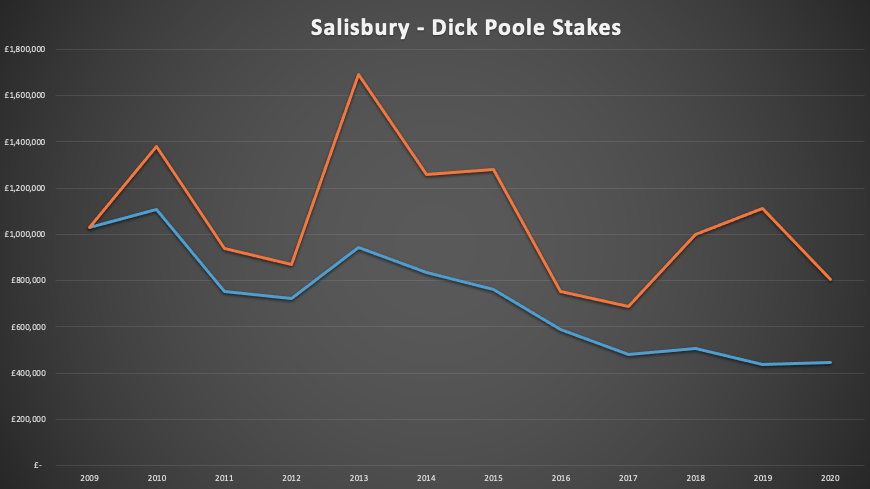
It’s interesting to see what is happening in the intervening years in this particular race.
There are always subtle modifications in the way that the market is created, such as the price of the favourite or the value of the race. But it is possible to rebase all of these factors to try and come up with a line of what happened over the intervening years.
The picture isn’t a particularly pretty one, ignoring some highlights, the market as a whole has not really grown. If you take into account inflation, the picture looks even poorer.
You could come up with reasons why this could be the case. But each year, I come back and gather extensive data on this race to see how it compares with prior years and how it’s changed. I then spend a day the following week digging through all the data to see if the biases and characteristics are still there. So I always look forward to the race, just for that reason.
When I look at the data next week, I reckon, apart from the overall volume, I’ll probably find the same underlying characteristics. But if I find something else, it will be a valuable marker for how the market has changed.
At its core, there are some core fundamentals to the market. How it’s priced and moves but, as I found out, what people will do about that is the most important.
Trading is really a game of anticipation and timing. If you can work out what is likely to happen, then you should be able to anticipate what people will do.
Always bear that in mind when you are trading.
