The unique technology that’s changing horse racing
Once in a while, technology comes along that changes everything.
The horse racing industry doesn’t have an outstanding reputation for innovation, but new technology will transform how people bet and trade in Horse Racing.
Total Performance Data has been working hard to bring cutting-edge data and information live from racecourses worldwide. You no longer have to guess how a horse ran a race; you can see the data in real time from the racecourse.
Using Bet Angel, you can see that data and visualise it on a map the same way you would when using a map for driving directions.
It is completely revolutionary!

How does it work?
This data is presented in a format that allows you to see how the horse performs in real time.
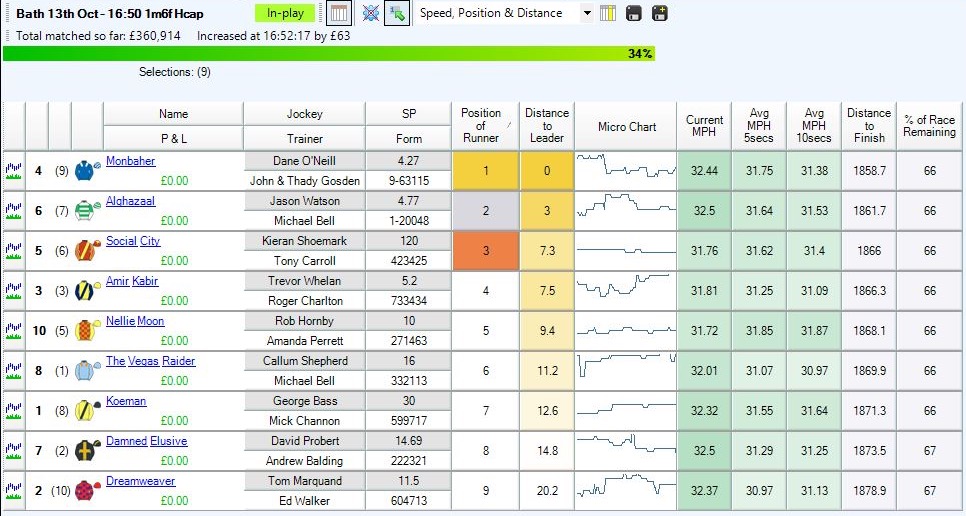
At a core level, you will get to see critical data such as: –
Speed, par speed, velocity fluctuation, velocity error, stride frequency, par stride, cadence error, distance travelled, distance to finish, % of race left, position in the race and the distance behind the current leader.
You even get to see latitude and longitude, which means you can see all the horses on a real-time map.
Don’t worry if you don’t understand this data. As if you are a Bet Angel user, we have created several ‘plug and play’ templates that allow you to see this data on your favoured betting or trading screen in just a few clicks.
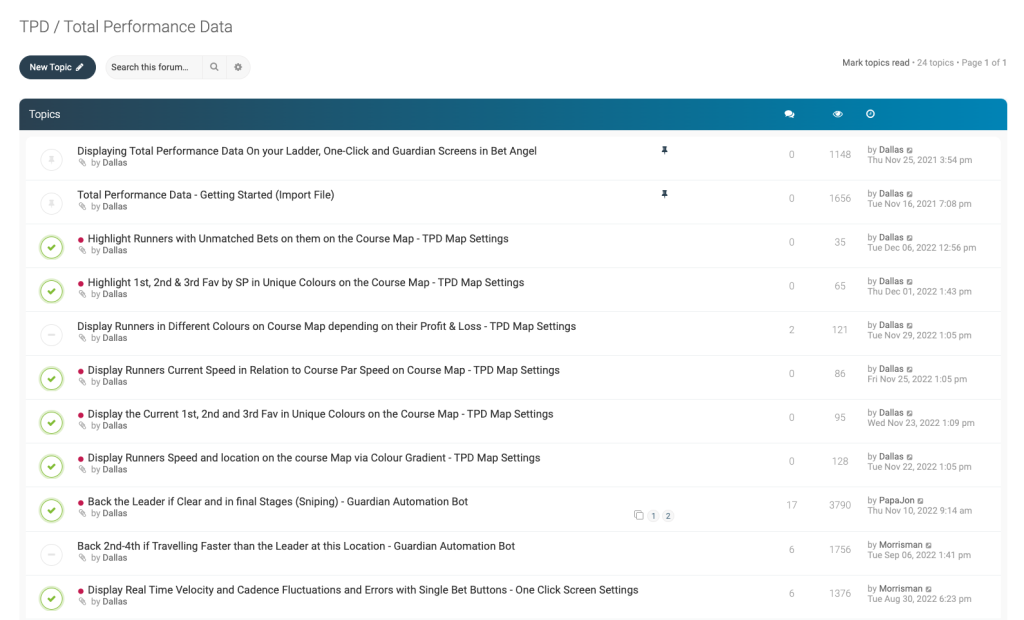
Just visit the Bet Angel forum where we have a dedicated area for Total Performance Data.

The real power of having access to this data is that you can get a much deeper insight into how a race has been run or is being run.
For example, if a held-up horse is a certain distance behind the leader but speeds up within a certain distance of the finish. Bet Angel can alert you to that fact.
You can be prompted by a change in colour on your screen, on a map, or via a sound or text alert.
I know it’s a cliche, but the possibilities are endless!
Par for the course
Some of this data can be used historically to excellent effect as well. Included in the data sent from the course are the par values for each runner in each race.
You get this critical data for each runner in each race and course.
As you may be aware, race courses vary dramatically in the UK. You can have a reasonably flat course or one that undulates dramatically over its entire length. Does the course finish on a steep gradient? What is the fastest and slowest part of the course? More importantly, given the conditions, how will your horse run on it?
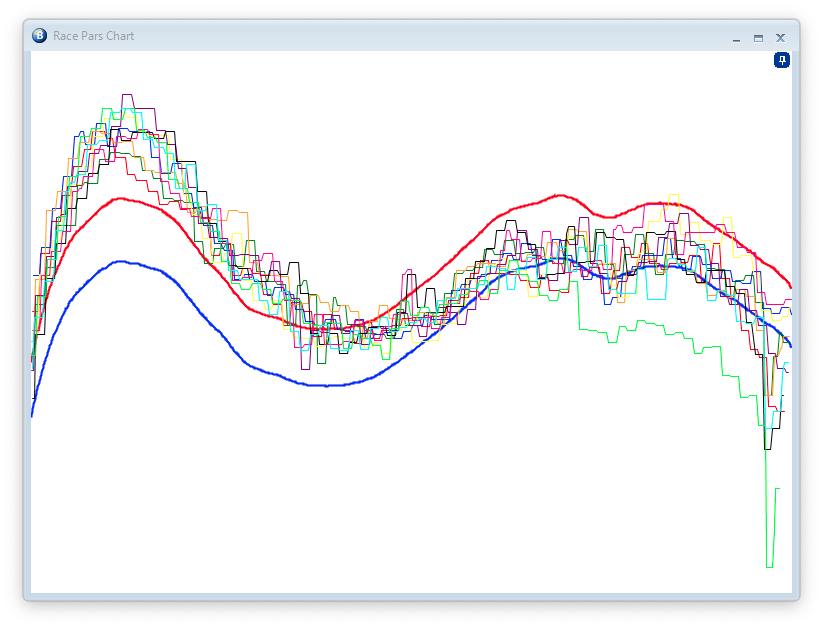
The par data will show you all this data in any format you wish, and the par chart will plot this dynamically for you in real time.
Suppose a race gets off to a slow start and runs below par for the first part of the race. The race is likely to favour a front-runner, who can pick up speed in a favourable position in the latter stages.

Real-time tracking map
The easiest way to understand the power of this technology is when you see a real-time tracking map. When you connect Bet Angel to the data feed, you will immediately see the horses as they get saddled up in the stables.
The benefit of this is that you can keep an eye on the preliminaries even if you have no TV pictures. This a relatively frustratingly common situation on busy days on the racing channels.
You can watch the horses go around the parade ring and then out to the starting post.
Of course, as the race gets underway, you can watch the horses run the race in real-time. You will find that the live data often arrives 5-6 seconds before you can see it on the racing channels on ‘live’ TV.
It is a huge game-changer.
Getting started
To get access to this cutting-edge technology. You will need a current version of Bet Angel Professional and a license key from the data provider to visualise the data.
You can download a free trial of Bet Angel Professional here. Additional help is available via Bet Angel support or the forum.
If you bet or trade on horse racing, this technology will completely transform your understanding of the sport.