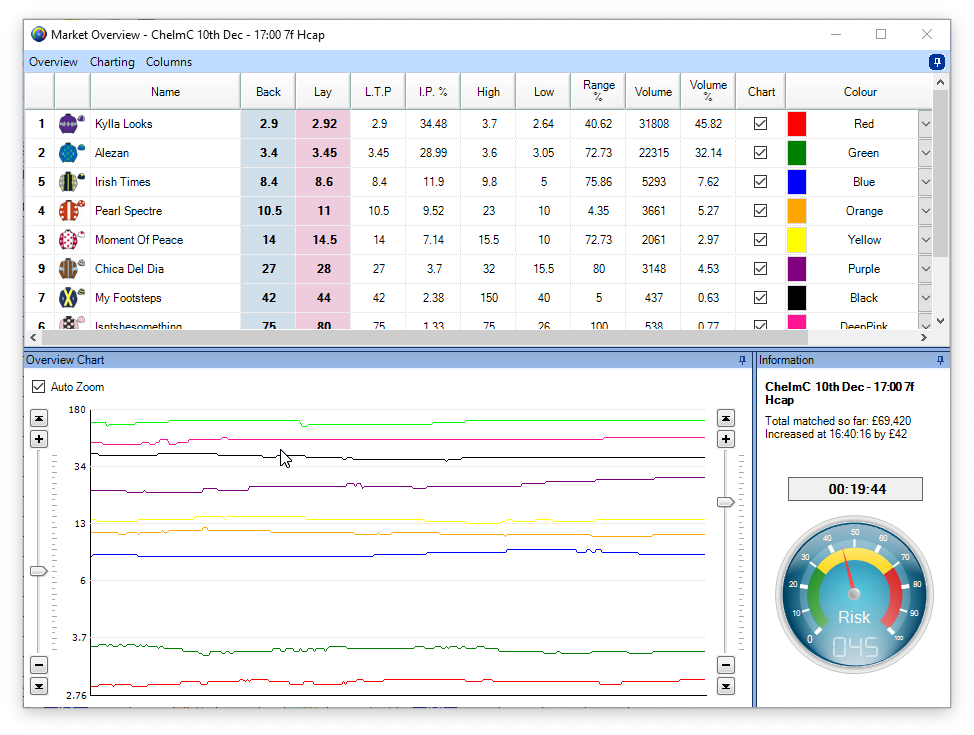
Market Overview Screen
The Market Overview screen on Bet Angel is an indispensable feature that has been integral to the software since its inception.
Over the years, we have continually tweaked and refined this tool, ensuring it meets the evolving needs of our users.
Here’s a comprehensive guide to the Market Overview screen: what it does, how you can customize it, and the best ways to leverage its capabilities for your trading and betting strategies.

Key Concept
The key concept of the Bet Angel Market Overview screen is to provide a comprehensive, real-time snapshot of the entire market. This includes crucial data points such as odds movements, market trends, volume indicators, and other vital metrics that help traders and bettors make informed decisions.
The Market Overview screen consolidates this information into a single, customizable interface, allowing users to efficiently monitor and analyze market dynamics, identify trading opportunities, and execute strategies with greater precision and confidence.
- All key information at a glance
- Multi chart screen
- Volume indicators
- Risk Meter
- Tabbed or consolidated view
- Customisable
- Detach drag and drop
- Custom sorting
- Works in the background
Main panel
The Market Overview can be displayed as either ‘Panes’ in a single window or in ‘Tabs’ were each of the three elements can be displayed in it’s own window.
Displaying as ‘Tabs’ the overview screen is split into three area’s, ‘Grid’, ‘Chart’ and ‘Information’, you can select which of these you wish to view using the tabs in the bottom left corner of the window.
The market sync option let’s you configure which market is displayed on the Market Overview screen. You can sync with a mouseover as well.
Main information on the Market Overview Screen

Reading from left to right there is a range of information available for you to view: –
- Racecloth number
- Silks, hover over these to get more information about the jockey and form etc.
- Back price
- Lay price
- Last trading price
- Implied probability (Chance of winning)
- Current high traded price
- Current low traded price
- Where is the current price in it’s traded range
- How much money has been traded on this runner
- What volume % does this runner have of the market
- Should this appear on the overview chart?
- What colour should this runner be
- What is the projected SP
- What is the actual SP (Only appears when the market goes inplay)
Risk Meter
On the bottom right-hand side here we have the Risk Meter.
This is looking in the market and telling you how volatile that is. It can do this exclusively for Racing and measures volailty by market type. It’s looking at each market and how it’s traded before and measuring how volatile the market is compared to similar markets in the past.
In this sense a handicap can be as volatile as a maiden, but only in relation to other races in that category. I.e. a volatile handicap, or a volatile maiden.
If it’s over in the red it’s saying the market’s very volatile, if over in the green, it’s saying it’s quite stable when you can see the yellow area here it’s saying this market is behaving pretty much as we expect. The risk meter is just giving you a view on the market and looking at how it is behaving based upon these types of markets historically, so that should prove useful.
Extensive Customisation Options
Bet Angel’s Market Overview Screen is highly customisable, allowing you to tailor the interface to meet your specific needs. Here are some key customisation options:
- Rearranging Columns: You can move columns around to display information in a way that suits your trading style.
- Resizing Panes: Adjust the size of each pane to focus on the most critical data.
- Display Styles: Choose between displaying information in panes or tabs, depending on your preference for organisation and ease of use.