Tennis Trading – Profit Graphs
Harnessing Profit Graphs to Master Tennis Trading
Trading tennis on Betfair can feel like flying blind—unless you build a clear visual map of what moves the odds.
Profit graphs give you that map.
They strip away the noise, show you the exact moments where risk turns into opportunity, and let you fine-tune every entry and exit.
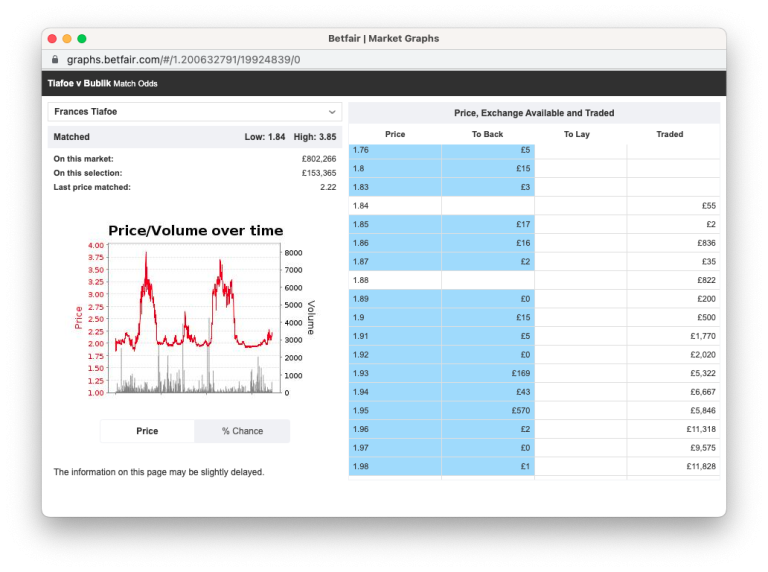
The Limitations of Standard Betfair Charts
A basic price chart tempts you to “lay low and back high”. Easy in hindsight, hopeless in real time.
What it doesn’t reveal is why the market swung when it did—or how much you could’ve banked by trading the ebb and flow.
The chart looks fab, but why did it happen and how much would you have made?
Profit Graphs – The concept
A profit graph, as used in Bet Angel, is a bespoke chart that tracks how a fixed-stake trading position would have risen or fallen throughout an event, plotting the profit or loss at every point so the highs, lows and cumulative swings are visible rather than only the final result.
By overlaying the market’s price action (and, if desired, live score data) it exposes the “critical moments” where entering or exiting would have been most lucrative, quantifies the total trading opportunity available, and provides a post-match visual audit that helps refine future strategies and maximise repeatable profits.
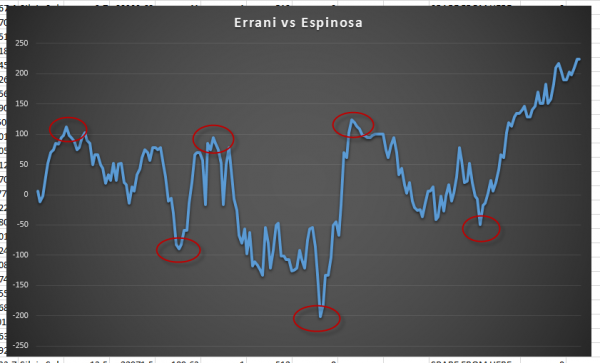
The graph you see below shows not the odds of the match itself but the return on the favourite by backing or laying the favourite. You choose which side you want to take.
From there, the graph will move into or out of profit. The Y axis plots the amount of profit (or loss, but let’s not go there), and the X axis plots the score in the match.
This way, you can see the precursor to a trading position in the market.
Building a Profit Graph: My Step-by-Step Workflow
When I’m trading tennis, the two features I rely on most are Tennis Trader and Guardian automation. These tools work seamlessly in the background, either on my main trading machine or another setup, to gather crucial data on the markets I’m involved in.
- Tennis Trader – Tennis trader allows me to capture real time score data
- Guardian – Allows me to monitor many matches at once
- Guardian Advanced Automation – Allows me to create a framework to capture data
Reading the Lines: Spotting Critical Moments
Compressing the raw graph into a cumulative view allows me to measure the total tradable opportunity in a match. Most contests offer multiples of the eventual outright settled profit, if you’re nimble enough to grab each swing.
Scaling the Technique Beyond Tennis
Live score feeds now let me overlay in-play horse-racing data on the same type of graph. Monday is my deep-dive day: I dissect every chart from the previous week, hunting for repeatable patterns across different sports. The approach sharpens my timing, boosts confidence, and—most importantly—keeps the profits compounding.
Action step: Fire up Bet Angel in your next tennis market, switch on automated P/L logging, and watch your own profit graph unfold. The insights you’ll gain in one afternoon will outclass weeks of staring at static Betfair charts.