Tips for Creating a Tennis Prediction Model
If you’re betting on Tennis or your Betfair trading tennis, then there’s one critical factor that you need to understand. What should the odds be? With that in mind, let’s create some Tennis odds.
When you go to betting sites, you will see a range of odds on offer, but knowing how to price up a betting market will help you profit. But how?
Value betting on Tennis matches
If you are value betting and you want to profit in the long term, you’re estimating what you think the betting odds should be, this is what they are and you would profit from that difference over a long period of time.
Betfair trading on Tennis matches
If you are Betfair trading, you profit from price movement. You are saying this is where the market is now, this is where I think the market’s going to be, and this is how the odds will change, and you will profit from the difference between the two.
However, both strategies have a key element: what the odds should be. To understand that, you need to create a model.
We will explore a betting model for tennis by creating some odds using publicly available data. This will allow us to profit from a straight-value betting strategy or a Betfair trading strategy by anticipating where the odds will likely go.
How to predict the outcome of a Tennis match
When you look at every sport, there is a fundamental underlying characteristic that allows you to define and create some particular model. Models can be as straightforward or as complex as you wish and can contain many different factors.
We will address the key question of the odds within a tennis match by giving you quite a simplistic example. We won’t overcomplicate it, it will be a good start point for you if you want to do this more seriously.
If we look at a tennis match, we need to identify what characteristics we can use to determine the odds. When you look at each sport, you realise that there are factors that are taken into account.
For example, when we look at football/soccer, what you will find is that it is straightforward to define what you’re trying to identify within a match. You’re saying how many goals will be scored and how they will be divided between the two teams.
If you work with a model that focuses on that, then you can pretty much predict what the odds are likely to be at any point during the match. Now, I have done videos on this, so watch those if you’re interested in doing this on football, but today, we will be focussing specifically on tennis.
So we need to come up with some metrics, a definition of exactly how we are going to price a tennis match. In fact, it’s a little bit easier than you would imagine because all of the publicly available stats are there. You can get them completely free and you can use them to create a model.
Today the metric that we’re going to use is the chance of a player winning a point on their serve. What we need to do is talk that through a little bit, so you get a better understanding of exactly what you’re looking at and how this is calculated.
How to create your tennis betting model
To begin we’re going to use publicly available statistics and then convert that data into a set of odds.
So where do you find these statistics?
If you go onto the ATP and WTA websites, you will see a stats section. If you look at that stat section you can actually examine all of the players together and rank them or you can explore individual player statistics.
If you want to pull this data in automatically
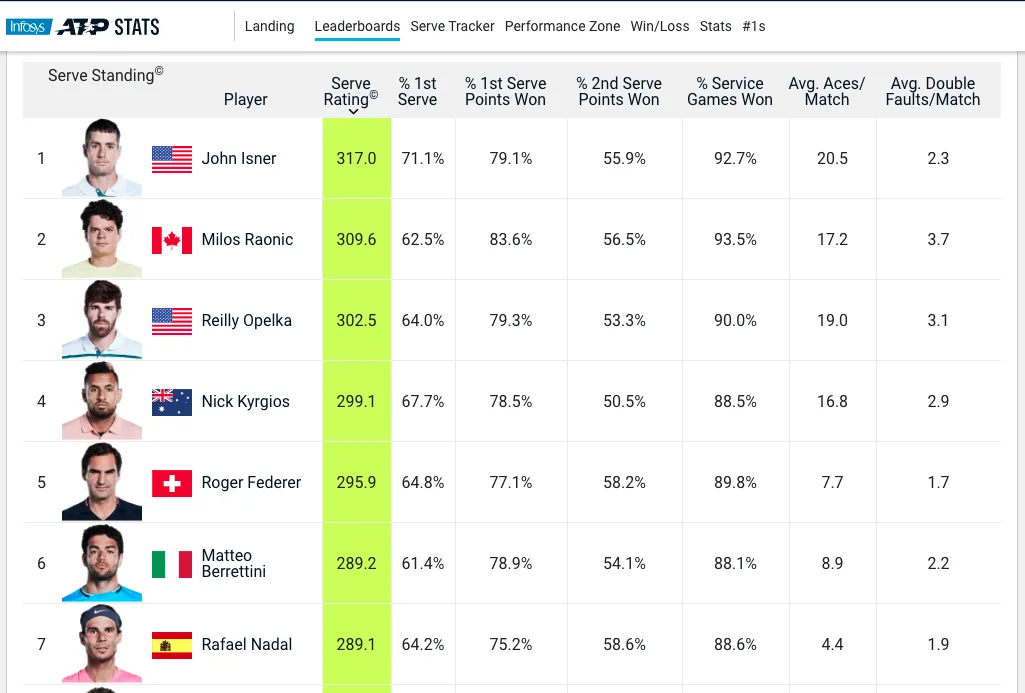
These are some statistics above that I brought up on a player on the ATP website and you can see things like the first-serve percentage, how many points they won on first serve return data and their breakpoints.
Your model can include all of it or just a little part of it. That’s up to you what level of depth you want to go into, but today we’ve created a simple model here that just uses part of this data to come up with some pretty accurate results. So let’s have a look at how we have constructed that using this particular data.
Doing the maths…
| ~ First serve in = 62 (out of 100) – Wins 79% of 62 = 48.98 |
| ~ Second serve points won = 57% – Wins 57% of 38 = 21.66 |
| Total = 70.64% |
So, on this particular data, what we’ve done is we’ve taken the first serve percentage and said that 62 times out of 100 serves, that first serve will go in and therefore, the returner will have to return that and play a shot.
But of course, that means that 38% of the time, that first serve didn’t go in. So this particular player, when they serve 62% of their first serves, actually go in, and then that particular point is played.
Now, of that 62%, they actually end up winning 79% of those particular points. So we can actually do a really quick calculation here and say that 62% of the time they win a point 80% of the time and if we combine those two together, we come up with a figure of roughly 49%.
So we can say that when that player does that first serve, they’ll win a point 50% of the time. However, we also have this issue that sometimes they don’t get that first serve in and therefore they have to play a second serve.
When you play a second serve you’ve got to get the ball in or you lose a point. When this particular player plays a second service then the chance of winning that point drops from 79% to 57%. However, we can now use that by saying if they win a point 57 % of the time on the second serve and that occurs 38% of the time, then they will basically end up winning a point at 22 times out of 100 on second serve.
So you can basically add those two together and then you end up with roughly 70%. Therefore, on just slightly over 70% of points this player will win on serve. Now we’ve combined the first serve and the second serve meaning the chance of them winning a point on either and that comes up with about 70%.
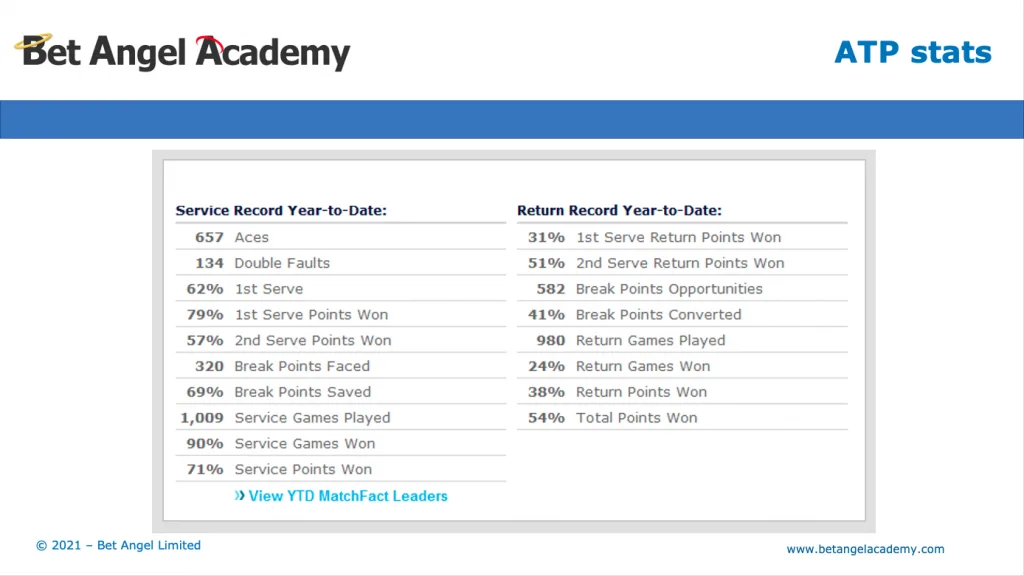
If you want proof that this logic is firm and understandable, just look at those stats. Have a look down towards the bottom of the stats and you can actually see that it says service points one, 71 %.
We have taken the data from the statistics on this website and actually produced and forecasted correctly the outcome of that particular set of services. So you can see how the data is related and that allows you to project forward or backwards based upon stuff that you’re seeing either before the matches started or as the match is actually in-play.
By using some of the statistics that we can see available, we can actually work out the chance of a player winning a point when they stand up and have a serve. This is the key metric that we’re going to use to calculate some of the odds that we expect to see within the Tennis match.
So now that we have that serve percentage, we can actually turn it into some odds. The way that we’re going to do that is we’re actually going to do some simple maths to be able to work this out.
The power of numbers
We know that the player wins a point when they serve about 70% of the time. So we can actually take that and allow us to push forward to create the odds that they will win a particular game. The simplest way to do this is to look at them serving and going 15 love, 30 love, 40 love, game.
So if they can win four points in a row, then they will win the game. We can do that calculation really easily because we know that’s just short of 71% chance of them actually winning a point on serve. Now if we raise that to the power of four, so we’re basically saying 70% chance of winning a serve four times to the power of four and that actually ends up giving us a percentage.
| Average of 6-7 points per game |
| 40-0 =4 serves ~ Single point is 70.64% ~ .7064^4 = 25% =4.00 decimal odds |
So if we do .70, 70% roughly, you can see the exact calculations above at the power of 4, and we end up at approximately 25%.
So we’re saying here that the chance of winning a service game to love is about a one-in-four chance if their chance of winning a point on serve is just short of 71%.
| Winning to 0 | 24.8% |
| Winning to 15 | 29.2% |
| Winning to 30 | 21.5% |
| Winning to deuce | 15.2% |
| Winning the game | 90.8% |
Then you can repeat this calculation for winning a game to 15 to 30 to Deuce and so on. You can actually iterate at this calculation for all of those different scenarios.