Using Profit Graphs to Trade Tennis
Standard Betfair charts
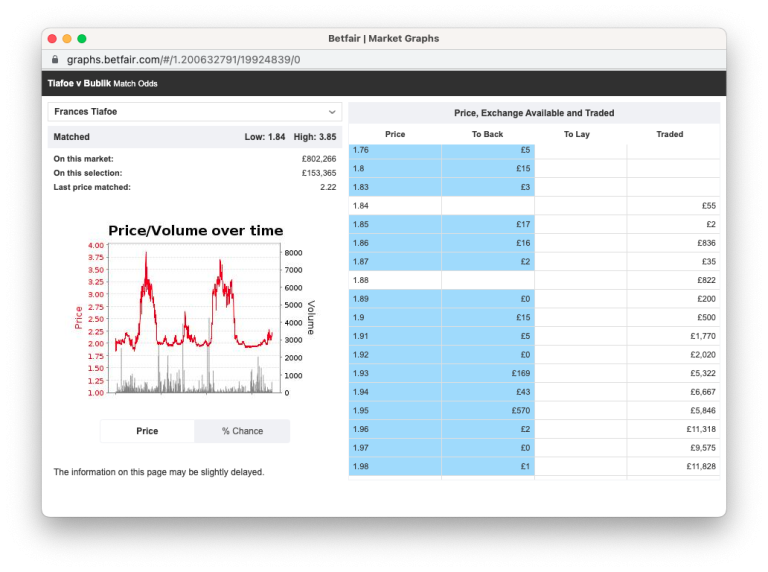
When you see a chart like this, it’s almost obvious what the entry and exit points would be. Lay at the bottom or back at the top.
Of course, everything is easy in hindsight. The really skill in Betfair Tennis trading is not about guessing where the top and bottom will be, it’s about knowing where the key points are in a match and how it affects your ability to trade it.

Why I create a profit graph
When I’m trading tennis, I use Bet Angel to keep an eye on how my positions are performing. The two features I rely on most are Tennis Trader and automation. These tools work seamlessly in the background, either on my main trading machine or another setup, to gather crucial data on the markets I’m involved in.
This approach is particularly effective in tennis because it highlights key moments within a match, showing me how I could have traded more effectively. By pulling in data from the markets I’m trading, I can analyse my performance and identify critical trading points. Regardless of the outcome, I review this data afterwards, making notes to improve my future strategies.
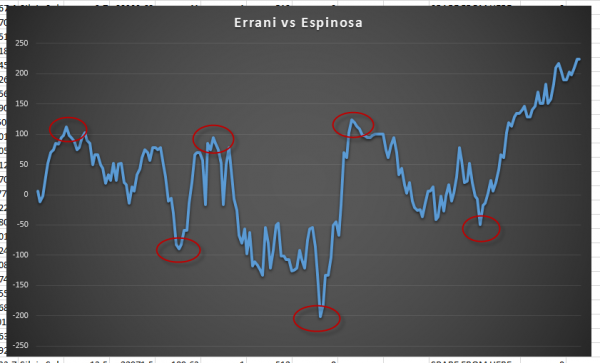
In the first graph, my focus is on where the profit opportunities were during the market. I’ve highlighted the market’s peaks and troughs. If you look to the left, you’ll notice the swings in profit or loss that occurred with a fixed stake. This illustrates my profit (or loss) at different points in the match.
This analysis demonstrates the advantage of trading over betting. From a betting perspective, the market settles in favour of just one selection. However, by trading, you have the potential to profit multiple times on either side, maximising your opportunities throughout the match.

More complex data
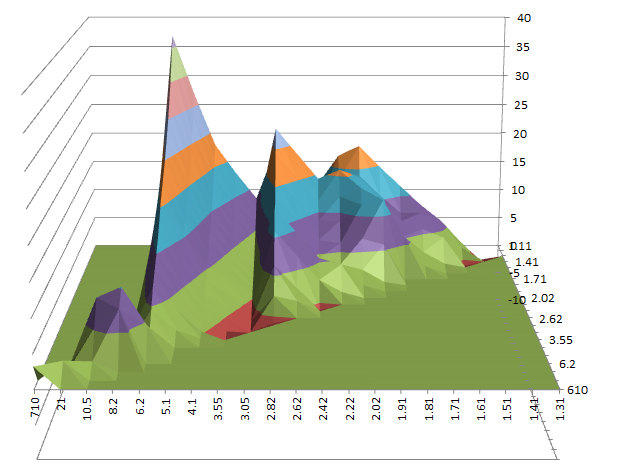
The second data set focuses on how to trade the market by identifying the critical profit points and the total opportunity available.
Imagine compressing the first graph to the left and summing up those swings. This provides a clear picture of the total opportunity and highlights the optimal moments for trading in and out.
Analyzing this data helps you pinpoint the key moments in a market and where to find them in the future. The idea is to jump into the market ahead of these key points. However, this is often easier said than done!
By understanding these critical profit points, you can refine your trading strategy and improve your ability to capitalize on future opportunities. This insight is invaluable for enhancing your trading skills and maximizing your profits.

Bet Angel also provides live score data, which can be overlaid on individual graphs or aggregated to offer a comprehensive view of where the opportunities were in a market. By analyzing what worked in the past and understanding why, you can approach future markets with much more confidence.
Knowing the key opportunities allows you, as a trader, to anticipate when these markets will occur and make timely trades around these critical points.
Since the introduction of live racecourse data, I’ve started applying this method to in-play horse racing markets as well. Every Monday, I dedicate significant time to analyzing and reviewing all this sort of data. This practice enhances my understanding of how various sports trade and why, using the same techniques.
By continually refining your approach with this data, you can become more adept at identifying and capitalizing on key trading opportunities, ultimately improving your performance and profitability.