Understanding your VPS performance
Suppose you find that your VPS is a bit sluggish or not performing as expected. Here are some things you can do to check up on its performance.
Basics first
If you haven’t restarted your VPS recently, then this is the first step. Rebooting your VPS will clear out any stale processes, providing a fresh start.
It’s a good idea to do this regularly, and it’s the first place to start.
It’s also important to check your Wifi connection. You can do this by switching off the WiFi on your smartphone and trying to connect via cellular connection.
Sometimes it’s also worth rebooting your router, in case your IP is causing an issue.
Make sure you are up to date
You should also ensure that any Windows updates are applied to your server. If you don’t regularly update the server, it may start updating in the background, which can impact your performance.You should also ensure that any Windows updates are applied to your server. If you don’t regularly update the server, it may start updating in the background, which can impact your performance.
Check your hard drive space
Bet Angel can store data on your hard drive when it puts markets into Guardian. This can use up a fair amount of hard drive space, which can cause performance issues.
If you have installed additional software such as dropbox, this can cache information which can also increase hard drive space.
Check the amount of available space and clear down the hard drive, and re-check your performance.
Multiple screens and Video playback
Remote Desktop Protocol (RDP) sends input from a local device to a remote Windows computer and returns the graphical output over a network. It’s not ideal for multiple screens because handling several displays at once greatly increases bandwidth usage, latency, and reduces performance.
Attempting to use multiple displays or displaying video with signficantly impact your experience.
WiFi and Routers
Sometimes, not connecting to your VPS or getting a bad, jerky connection could be due to your connection. It common for your Router to allocate an IP that doesn’t work, or connect to your server.
If you experience this, simply reboot your router to get a new IP address.
If you are seeing a degraded performance, it’s worth connecting to your server via your smartphone with the WiFi switched off, to see if that is the cause.
Distance and Latency
The first thing to note is that you will always experience some latency between your device and the VPS. A VPS works by compressing the screen image on the remote desktop and sending it to you.
If you are based a long way from the UK, the screen image still needs to reach you. Therefore, you will experience latency that reflects the distance. The longer the distance, the longer the latency.
Software
Bet Angel Server edition is optimised for use on a VPS. Other software may not be. So it’s worth checking to see if certain software is causing performance issues for you. The following section helps you further diagnose these sorts of issues.
If you have considered ALL the items above, it’s time to examine the key performance of the VPS more closely. Here is how you would do that: –
1 — Open Task Manager
| Way | Steps | When it helps |
|---|---|---|
| Keyboard shortcut | Press Ctrl + Shift + Esc | Works even if the taskbar is hidden or frozen |
| Taskbar menu | Right-click a blank part of the taskbar → choose Task Manager | Quick when you can see the taskbar |
(If you are on a remote desktop session, these shortcuts are sent to the server as long as the remote-desktop window is active.)
2 — Switch to More details
- When Task Manager first opens it may show a tiny list of open apps.
- Click More details at the bottom-left.
- Task Manager now shows several tabs across the top: Processes, Performance, Users, Details, Services.
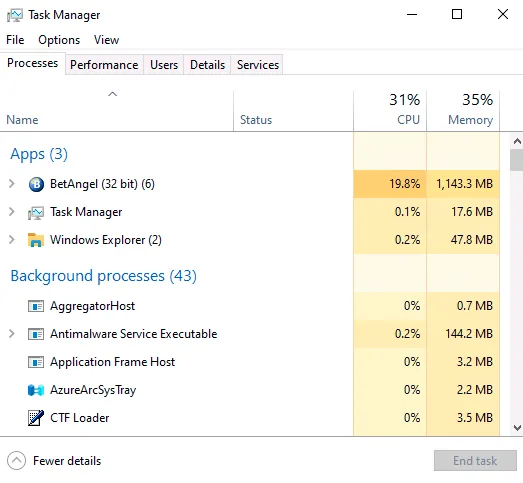
3 — Understand the Processes tab
| Column | What it tells you | First thing to look for |
|---|---|---|
| Name | The programme or service running | Anything unfamiliar or obviously out of place |
| CPU % | How much processor time the item is using right now | Items stuck high (e.g. 50 – 100 %) for minutes |
| Memory | RAM in use | One process using far more RAM than the rest |
| Disk / Network | Current read/write or network traffic | Spikes that match slow-downs you feel |
Tip: Click a column heading (e.g. CPU) to sort and bring the hungriest processes to the top.
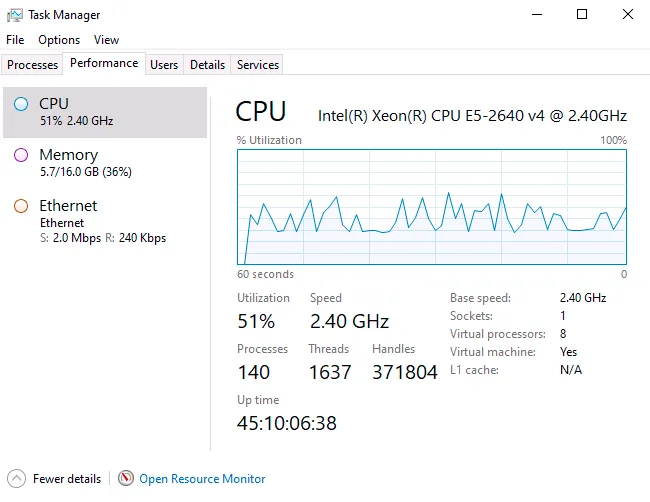
4 — Read the Performance → CPU view
- Select the Performance tab.
- Choose CPU on the left.
You will see:
| Item on screen | Plain-English meaning |
|---|---|
| Utilisation % (large number) | Overall CPU workload. Under ~70 % is comfortable; near 100 % for minutes means the server is straining. |
| Speed | Current clock speed in GHz. If this is well below the base speed printed on the server spec, the chip may be throttling to keep cool or save power. |
| Cores / Logical processors | Real cores vs. Hyper-Threading “virtual” cores. More means more tasks can run at once. |
| Up time | How long since the last restart—handy for spotting unexpected reboots. |
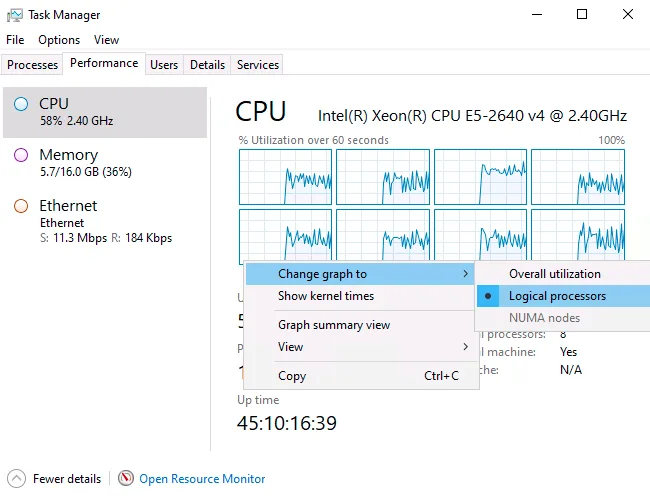
| Mini graphs | Each small graph is one core or thread. One graph pegged while others sit low shows a single-thread bottleneck. |
If CPU usage looks fine but the server feels slow, click Memory, Disk or Ethernet on the left to see if another resource is the culprit.
Summary
- Ctrl + Shift + Esc to open Task Manager.
- Click More details once.
- Processes tab: sort by CPU or Memory to find greedy programmes.
- Performance → CPU: big utilisation number good? Great. Big number bad? Time to investigate.