Creating Custom Advanced Charts
To create a new custom chart click on the  button at the top. This will create a blank template populated with a basic ‘Price’ chart, as detailed below.
To gain ease of use and to familiarise yourself with various features, you can edit one of the existing charts. This is be done by clicking on the  ‘copy’ icon, you can now edit an existing chart without accidentally overwriting settings that already exist.
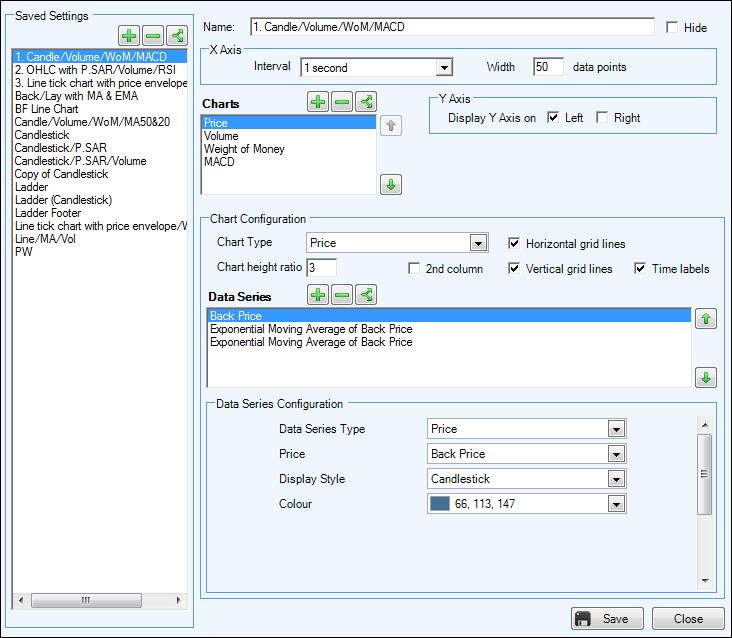
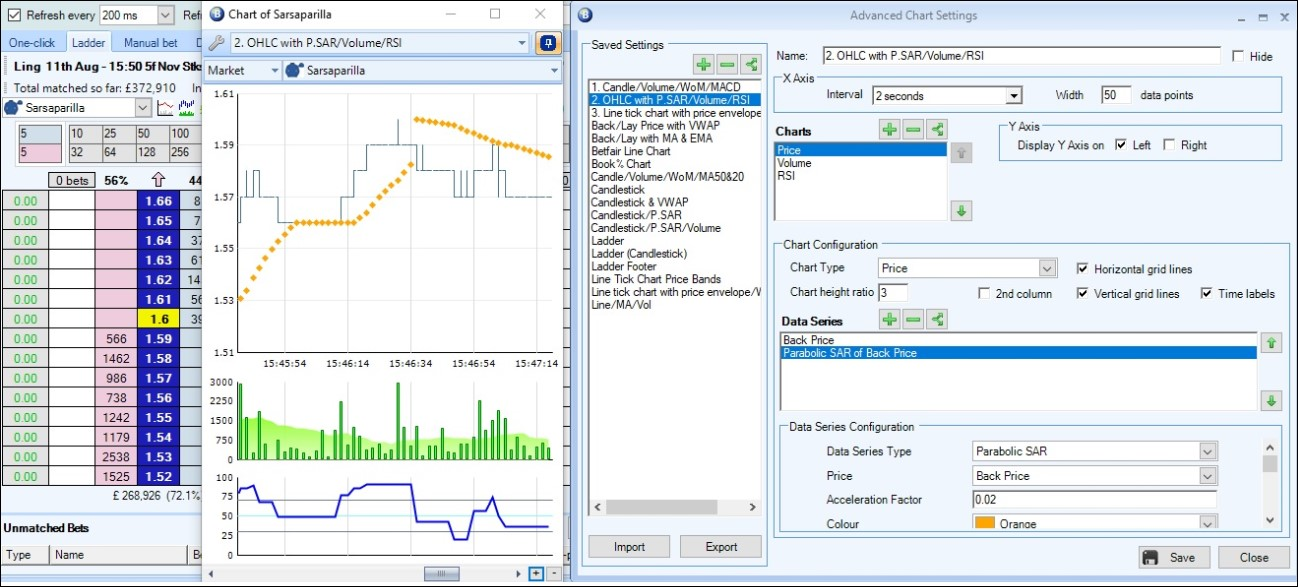
The main charting editing windows consists of three different areas.
Intervals/Data Width
Here you can configure the interval/refresh rate the chart updates and the width of data points it displays, for example if you set the 'Interval' to 5 seconds and the 'Width' to 60 data points that would update the chart once every 5 seconds and display 60 updates on your chart - that would mean you have 5 minutes of activity (5 x 60 = 300secs) displayed in your chart window.
NB,The scroll bar below the chart can be used to view earlier activity, when using longer intervals and assuming you have the markets in Guardian you can plot as much as 2 days of data on your advanced chart
Charts
The top layer named ‘charts’ allows you to create a charting pane. Clicking the ‘+’ icon in this area allows you to create a new charting window. You can create as many chart windows as you wish as they will all ‘stack’ on each other. Use the ‘chart height ratio’ to change the height of each of these ‘stacked’ charts.
Data Series
When you create a new charting window it will be blank unless you add a data series. A data series is automatically added when you create a new chart window but you may want to modify this.
Each main chart panel can be created as a Price, Volume, weight of money, MACD or relative strength chart. From there you can ‘layer’ additional information on each chart.
To add a new layer of information to the chart simply click the ‘+’ icon in the chart configuration area.
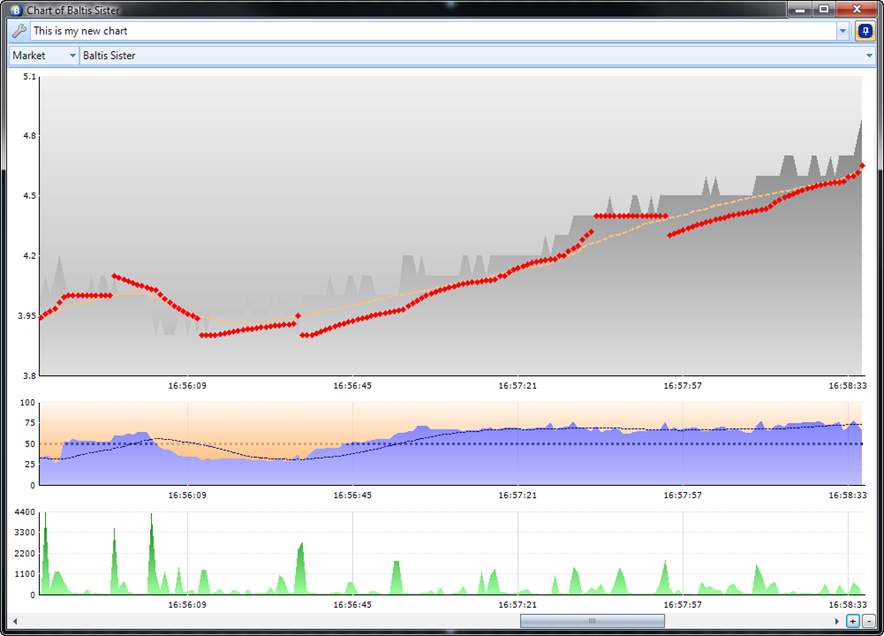
In this example chart we have created a price, weight of money and volume chart in the main charting panel.
History Lists
When configuring the 'Data Series' one of the options you have is to plot the 'Data Value' held in a History List.
For example, you could have a rules file applied to markets running in Guardian which stores the VWAP for all selections every second to 'History List 2', those data values can then be plotted onto an Advanced Chart to give you a VWAP chart line.
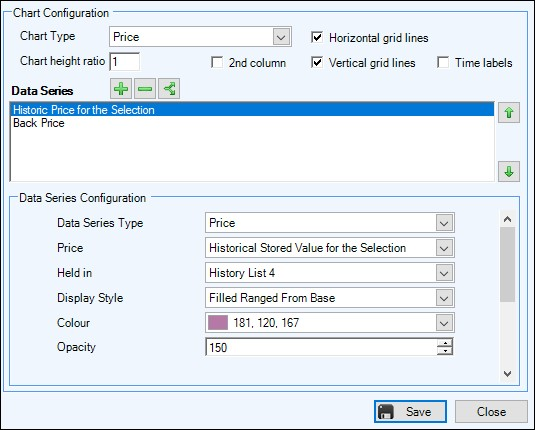
In the image below I'm configuring a chart that will plot the historical Stored Values for each selection held in History List 4,
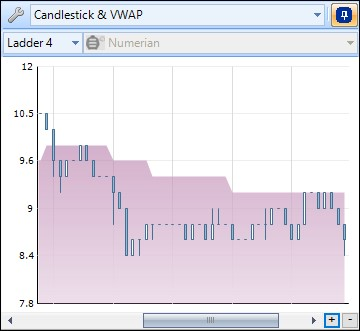
I've added this data series to an existing chart displaying the back price in a candlestick style, then using the 'Opacity' settings at the bottom I've created a layered effect to display the VWAP as 'Filled Range from the Base', and the original candlestick chart over the top.
The Bet Angel forum contains several ready-made rules files with dedicated History Lists you can download from the following page
Once imported and applied to markets you can create advanced charts as detailed above to look up values held in those History Lists.
Editing Charts
A handy tip when editing charts is if you open a market on your main trading screen then the advanced chart your about to edit open for a selection while you have the Chart Editor window open and are making changes, as you make any changes if you click the 'save' button in the bottom right of the chart editor window you will see the effect in real time on the chart you have open.
Examples
There are also ready-made Advanced Charts you can download and import into your chart editor from the 'Customization' section on our forum