Here we will cover all the settings relating to the interactive course map and par charts shown in the bottom half to the Total Performance Data settings window shown below
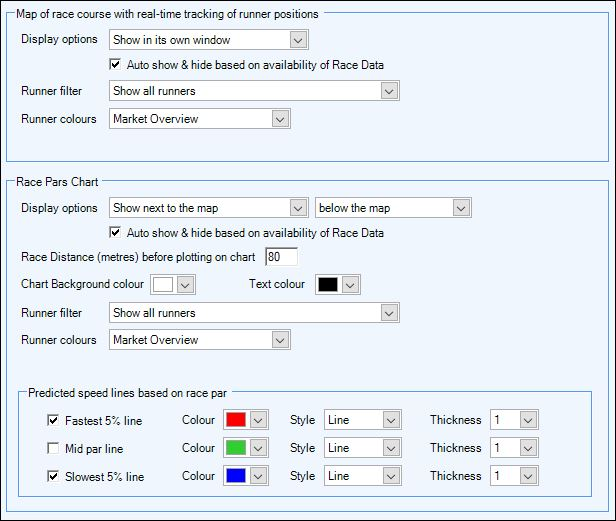
Map of Race Course with Real-time Tracking of Runner Positions
Display Options
Here you have the option of hiding the map, displaying it in its own window or displaying it in your
In-Play Trader window either at the top or the bottom
Auto Show & Hide based on availability of Race Data
Ticking this box will open the map automatically as soon as you are connected to a race supporting TPD
Runner Filter
Allows you to configure the number of runners displayed on a map. You can choose to display all runners, or to limit to a specified number of runners (either by lowest back price or by their position in the race).
You also have the option of limiting it to a number of runners only when in-play - this is very handy on races with larger fields but it still allows you to see the whole field while in the parade ring and going to post.
Runner Colours
Black - Displays the saddle cloth number of each runner on a black background.
Market Overview - Uses the colour of each runner as you have specified on your
Market Overview screen
US Racing Colours - Uses the US racing colours, ie, Red for runner 1, White for runner 2, Blue for runner 3 etc etc
Value Based (Saddle Cloth) - Allows you to configure and use your own
Value Based Colour Settings profile, with this option you can display each saddle cloth number in the colour of your choice
Value Based (Stored Value) - Allows you to use a
Stored Value (Shared) for the selection with your own Value Based Colour Settings Profile, giving you the ability to dynamically change the colours of each runner throughout the race
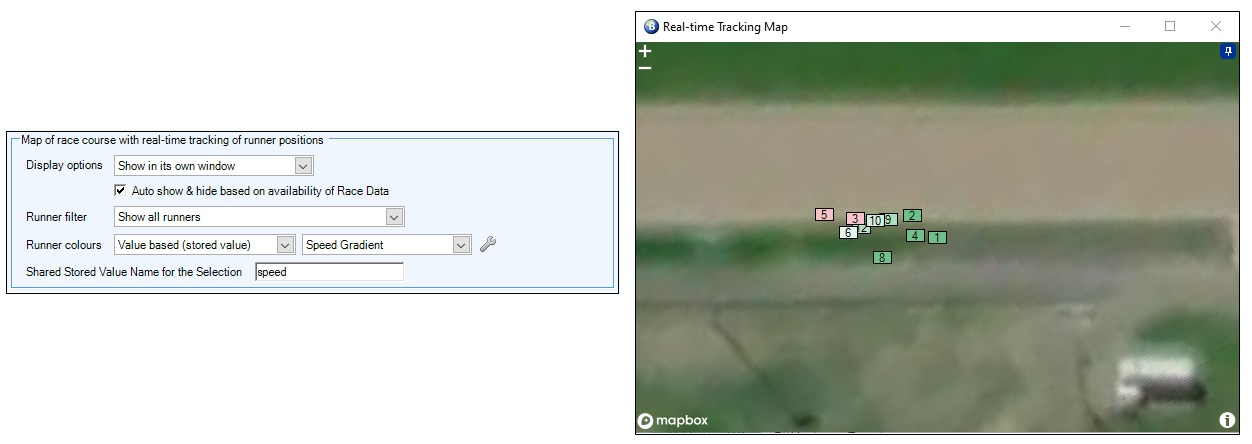
Example
In the example below I have the map displayed in its own window, this can be positioned anywhere on the screen and resized by dragging the sides and corners. The window size and position will be saved when the Screen Layout profile is saved.
For the runners colours I'm using a Shared stored value named 'speed' (the underlying data for this stored value is the current speed for each runner), for the colours I'm using a value based colour settings called 'Speed Gradient'; this colour setting is a colour gradient which goes from red to green depending on the speed each horse is travelling at
So the slower the current speed a horse is travelling the redder the colour will be on the map, and the faster the current speed a horse is travelling the greener the colour - this now gives a good real time visualization of where each runner is and how fast each one is travelling in relation to others around them.
Race Pars Chart
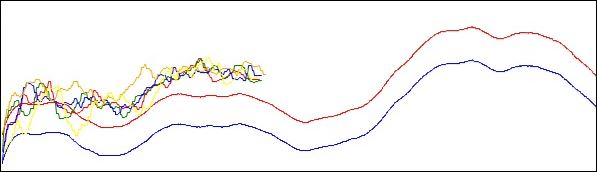
The race par chart displays in real-time the speed of individual runners over the distance of the race and compares that to race par (average/expected speed) information for the course & distance which has been prepared by TPD from its archive of previous races run. By default two speed lines are displayed, an upper speed line which is built from the fastest 5% of races run and a lower speed line which is built from the slowest 5% of races run, effectively creating a 'Speed Envelope'.
Before the race has even started this enables you to see where the fast and slow parts of the course are, then once the race is under way you will see how each horse is running in relation to the course par.
In the image below the first third of the race has been run at a much faster pace than the line showing the Fastest 5% of races run. It's unlikely that they will maintain this pace for the whole race so the second half of the race is likely to plot between the speed lines and you can look out for runners running out of steam.
Display Options
Here you have the options of hiding the par chart, displaying the par chart in its own window, displaying it in your in-play trader window (top or bottom), or you can choose to display it next to the map. When displaying next to the map you can also specify if you want the chart to be above, below, left or right of the map.
Auto Show & Hide based on availability of Race Data
Ticking this box will open the map automatically as soon as you are connected to a race supporting TPD
Race Distance (meters) before plotting on chart
Allows you to configure how many metres into the race a runner needs to have travelled before it starts to be plotted on a chart, most people would tend to want this to be from around the time they settle into a stride/pace which is typically 80-100 metres into the race. By removing the start of the race from the chart, you'll ensure the scale of the y-axis isn't spoiled by the initial slower pace of the runners.
Chart Background colour
Lets you specify the par charts background colour
Text colour
Allows you to specify the the text colour of the runners name (displayed when hovering the mouse over its chart line)
Runner Filter
Allows you to configure the number of runners displayed on the chart. You can choose to display all runners, or to limit to a specified number of runners (either by lowest back price or by their position in the race).
Runner Colours
These options are explained above in the 'Map of Race Course' area
Predicted Speed Lines based on race par
This section allows you to configure which predicted speed lines are shown on the par chart and the colour used, by default the chart will display the fastest 5% and slowest 5% lines
Example
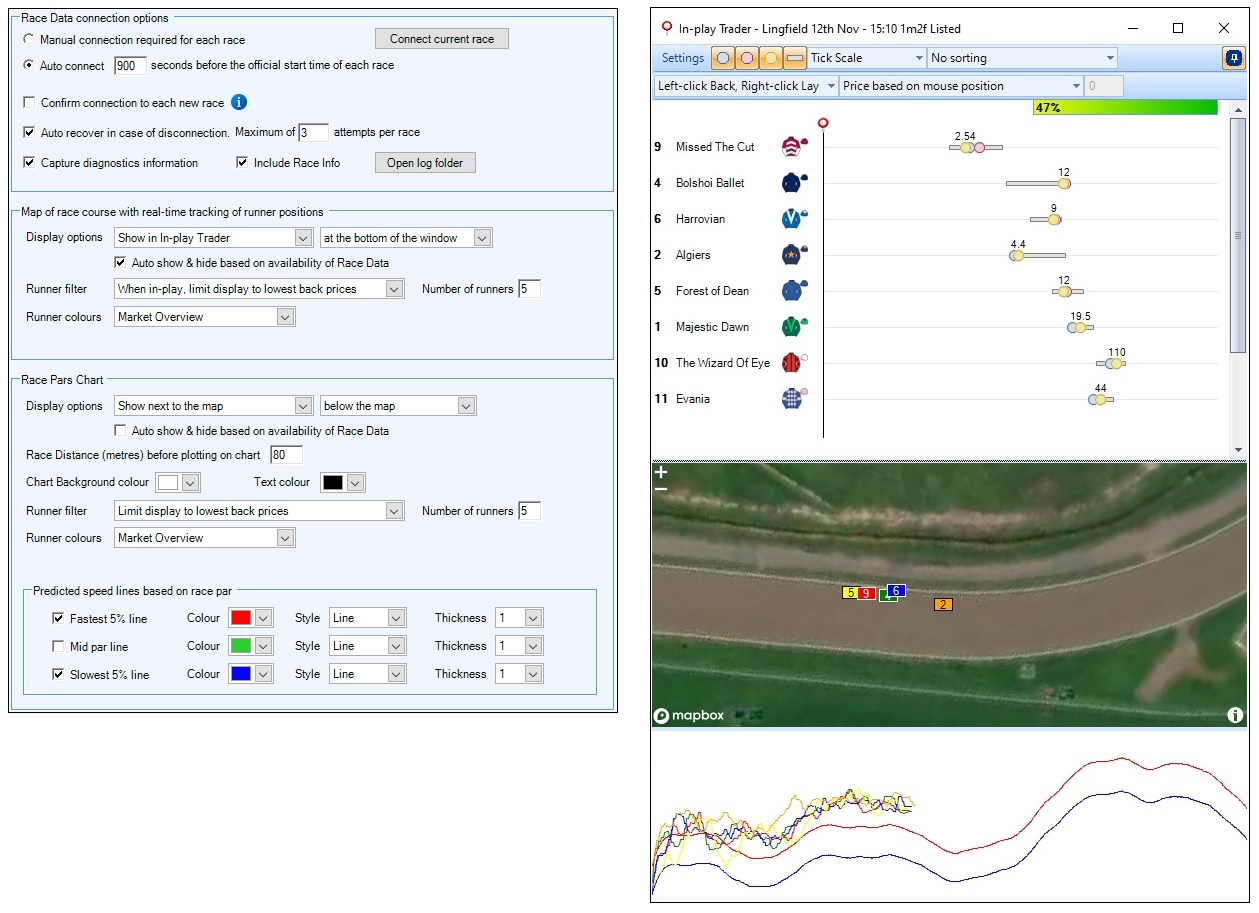
In the following example I have the map displayed at the bottom of the in-play trader window and below that is the par chart window, the colours for each runner on both the map and chart are those used on the market overview screen, I've also limited the number of runners displayed to 6 (by order of their back price).
You can see on the par chart that they have ran the first half of this race well above the par for this course and have even gone above the fastest 5% of previous races measured by TPD, so you'd expect to see the pace to slow as they begin to tire during in the second half of the race and can adjust your strategy to cater for this.
Error Reporting
In the event there are any issues with the data being sent from Total Performance Data' an error/warning banner will be displayed below the map and par chart windows with one of the following three warning messages
Clock - Start detection failure. Running time, progress and cumulative time may remain at zero. Or individual horses may be detected as not starting the race, affecting running order
Assignment - Assignment Error. Data may appear but be associated with an incorrect horse ID.
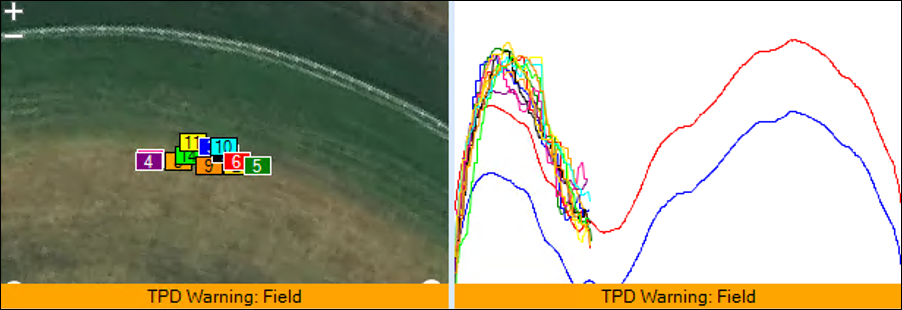
Field - Data appears for invalid horse. Despite best efforts by operators, there may be a time delay in removing an invalid horse (e.g. fallen rider; late non-runner).
Below is an example of a 'Field' warning sent from TPD
(Interactive) Betting via the Map
You can also place bets directly from the map by starting an Automation Servant, the selection context will be taken from the runner under the mouse (when runners are stacked on top of each other under the mouse, the one at the top is used)
NB, Before the start, the runners are stacked with the shortest price on top, but when the race is in-play the runners are stacked so that the leading runner is drawn on top.